Fig. 3.
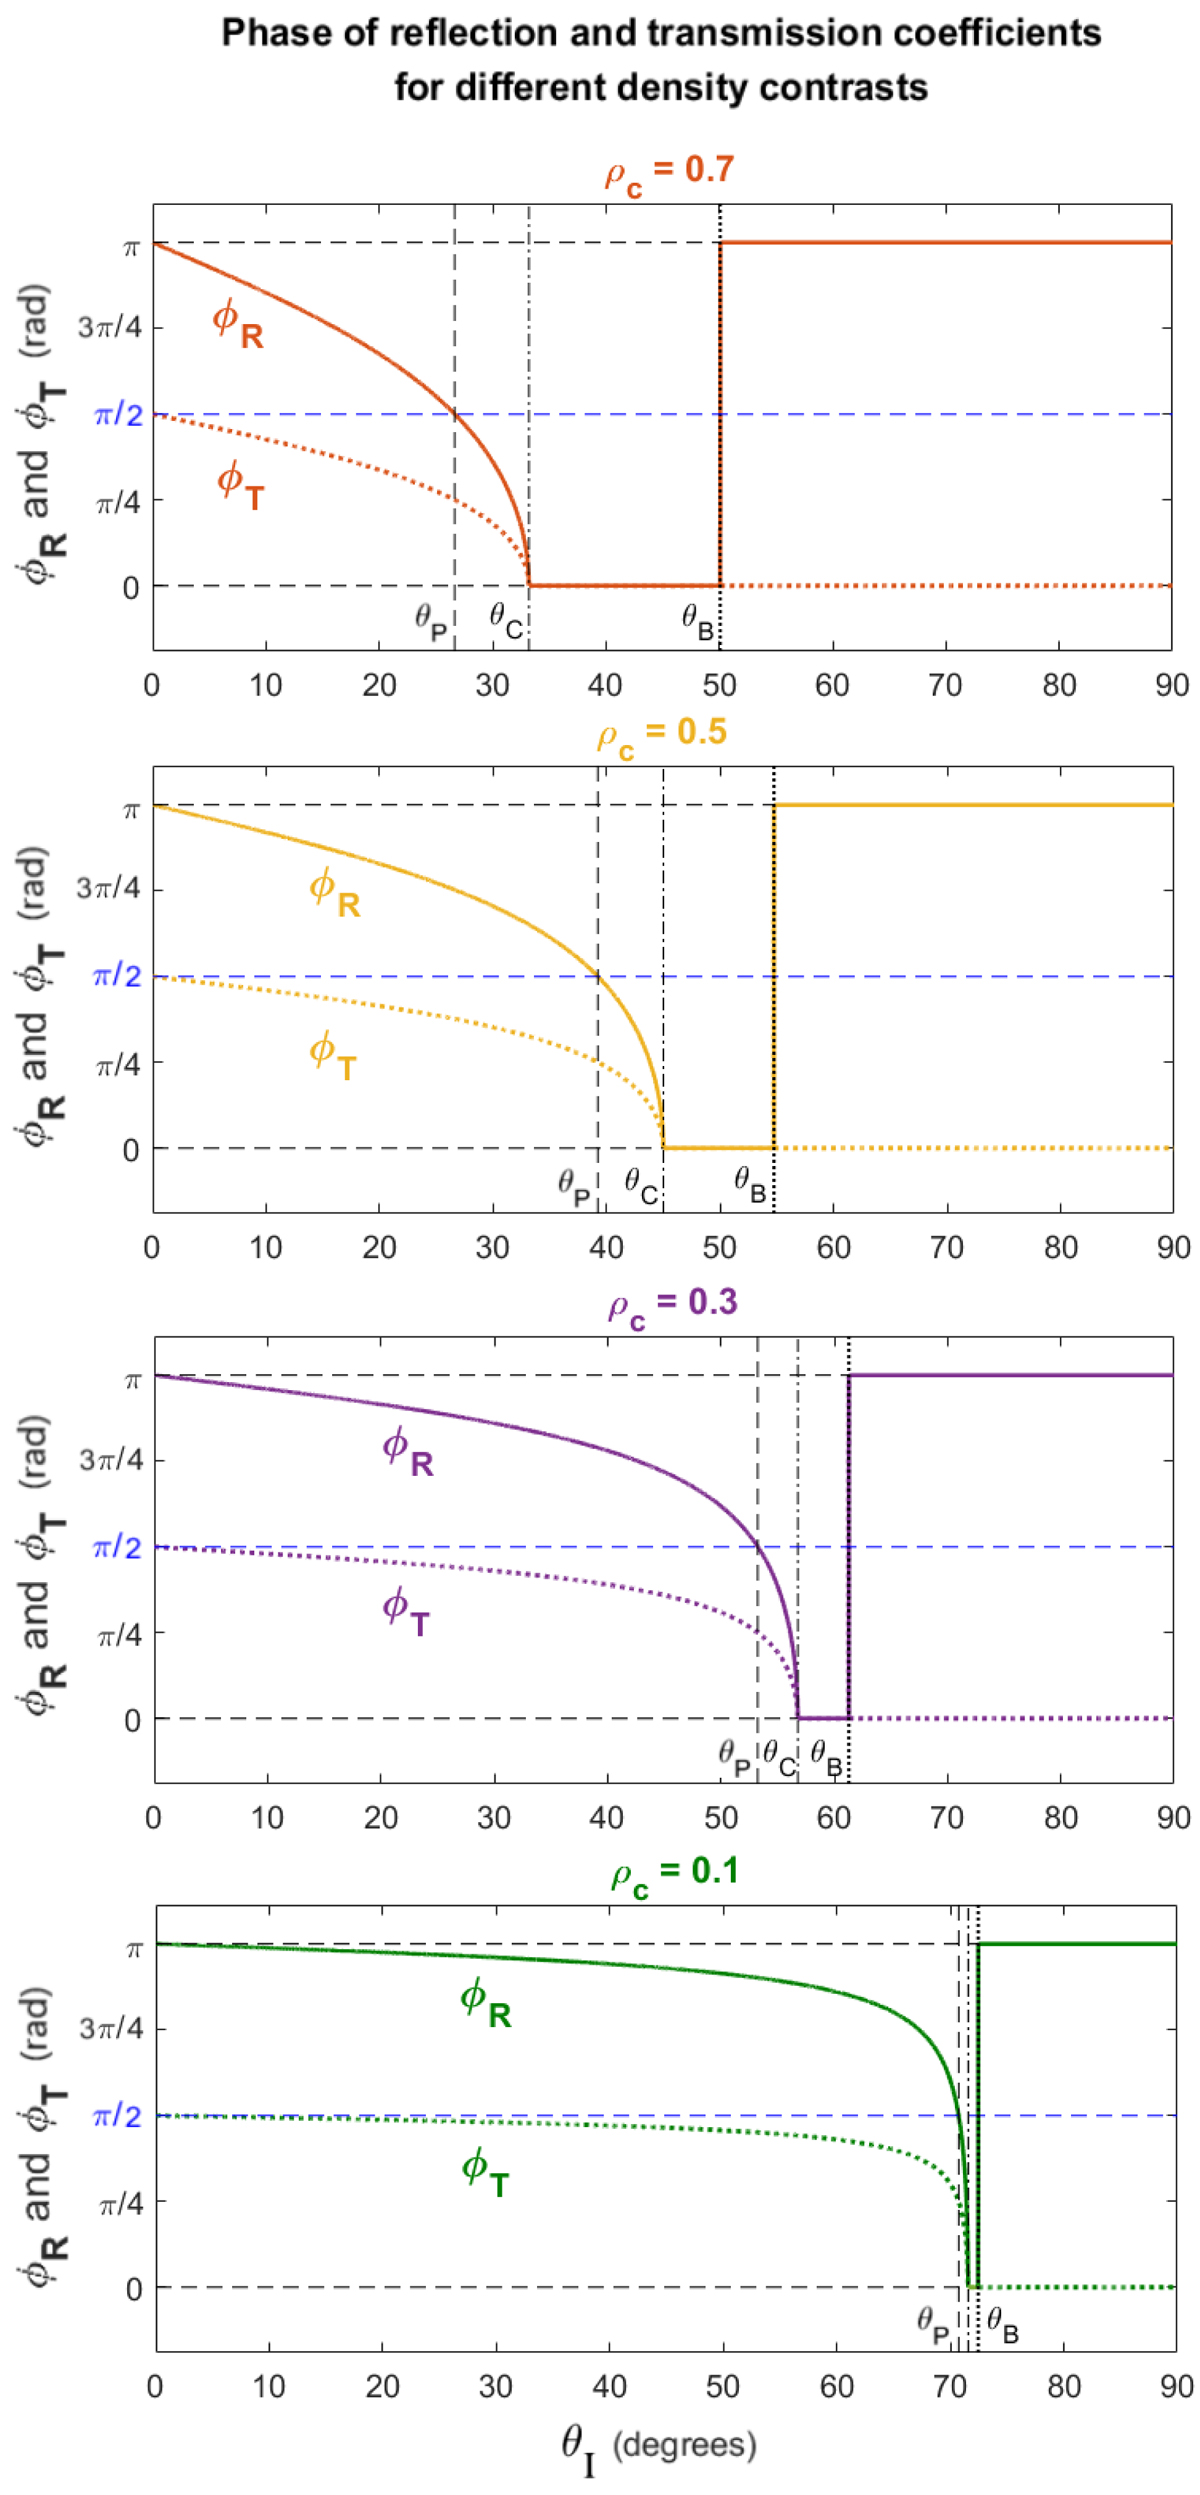
Phase of R and T as a function of the incidence angle, θI, for different values of the density contrast, ρc. The vertical dash-dotted, dotted, and dashed lines correspond to the Critical angle, θC, the Brewster angle, θB, and the Phase inversion angle, θP, respectively, introduced in Sect. 3. The black dashed horizontal lines correspond to the phases 0 and π. The blue dashed horizontal line denotes the phase difference equal to π/2 and one can see that its intersection point with ϕR defines the Phase inversion angle, θP.
Current usage metrics show cumulative count of Article Views (full-text article views including HTML views, PDF and ePub downloads, according to the available data) and Abstracts Views on Vision4Press platform.
Data correspond to usage on the plateform after 2015. The current usage metrics is available 48-96 hours after online publication and is updated daily on week days.
Initial download of the metrics may take a while.