Fig. 8
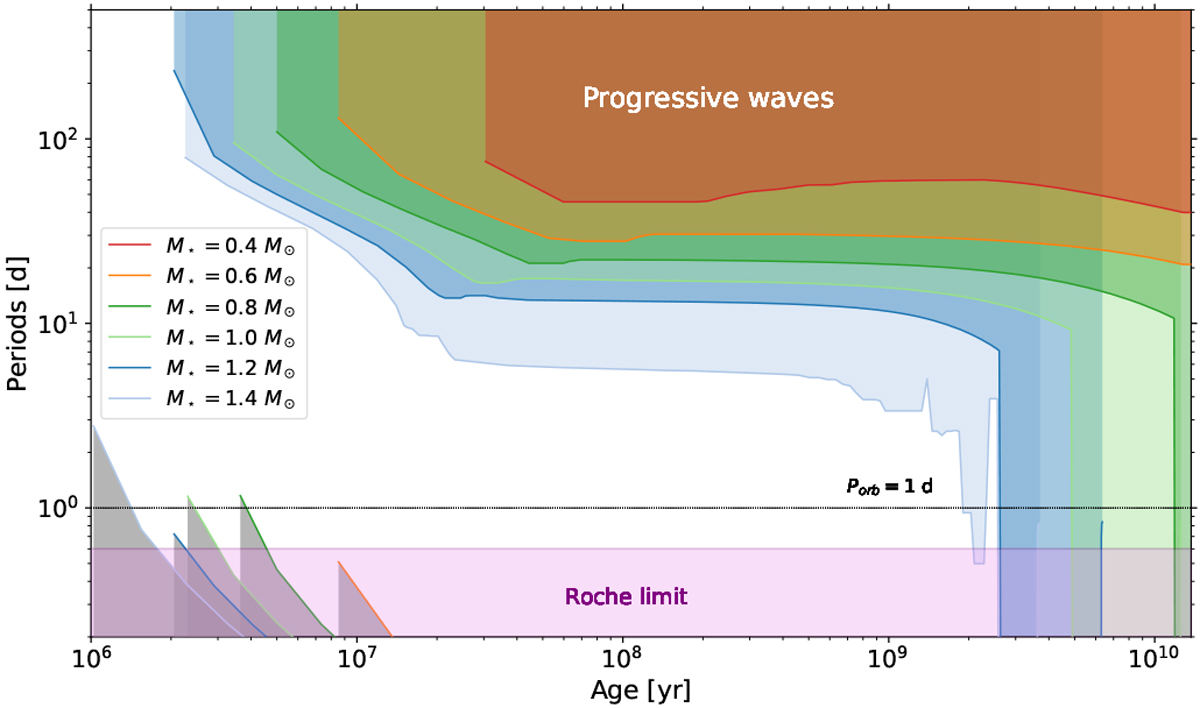
Characteristic periods as a function of the age of the system for stellar masses between 0.4 and 1.4 M⊙. In dark gray we plot the region corresponding to tidal frequencies greater than Nmax, for which no propagation of gravity waves is allowed. The colored areas correspond to orbital periods that are likely to excite progressive waves (with frequencies ω < ωc) for each stellar mass. In purple we show typical values corresponding to the Roche limit. The dashed black line corresponds to an orbital period of one day.
Current usage metrics show cumulative count of Article Views (full-text article views including HTML views, PDF and ePub downloads, according to the available data) and Abstracts Views on Vision4Press platform.
Data correspond to usage on the plateform after 2015. The current usage metrics is available 48-96 hours after online publication and is updated daily on week days.
Initial download of the metrics may take a while.