Fig. 6
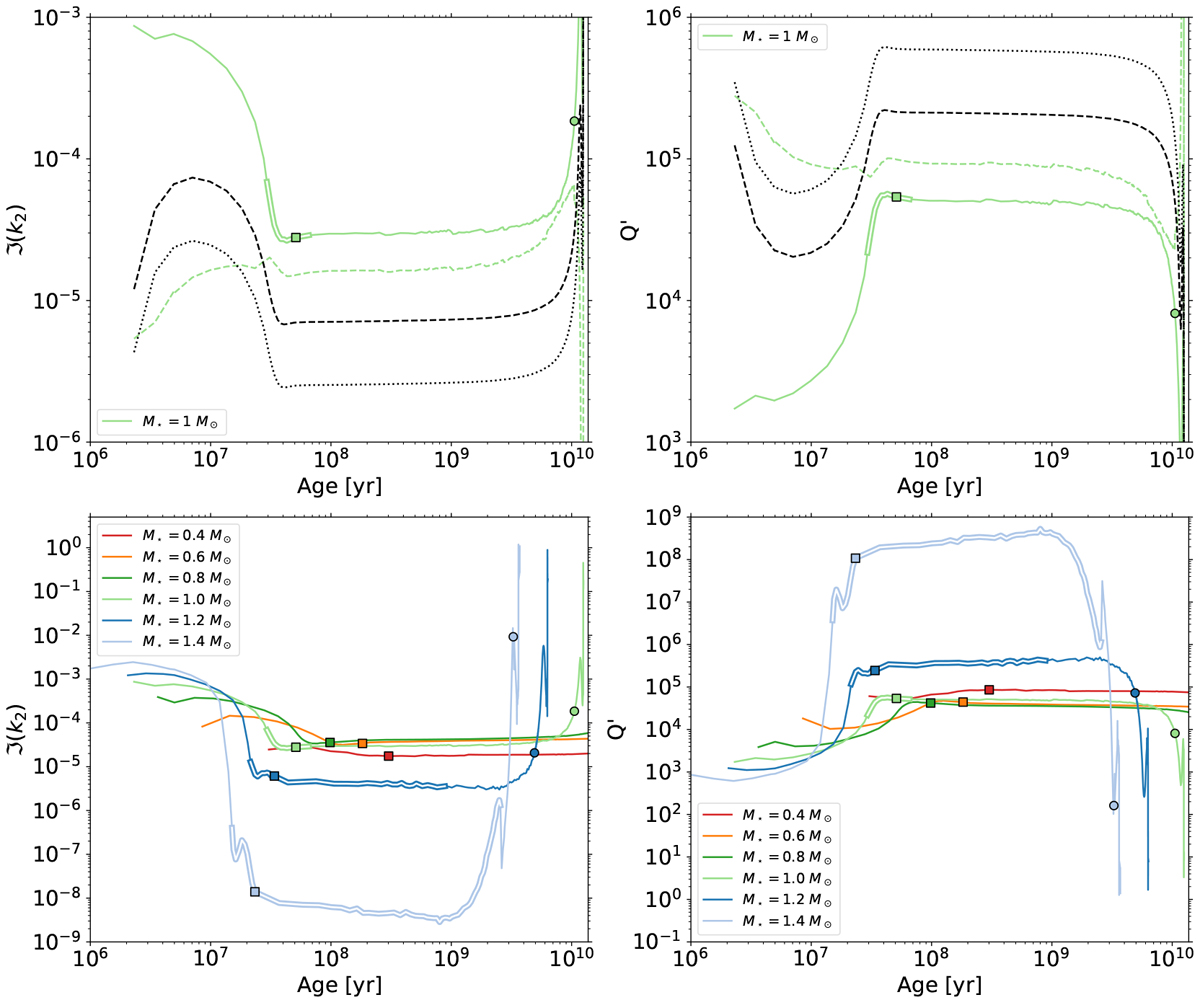
Evolution of the tidal dissipation and the corresponding quality factor as a function of stellar mass and stellar age. Top left: evolution of the tidal dissipation as a function of time for M⋆ = 1 M⊙ and Porb = 1 d. Top right: time evolution of the corresponding tidal quality factor. In green we plot the prescription developed in our work. Dashed green shows the simplified prescription for a thin convective envelope. The dashed black line shows the Barker & Ogilvie (2010) prescription. The dotted black line represents the Goodman & Dickson (1998) prescription. Bottom left: evolution of the tidal dissipation as a function of time for stellar masses (M⋆) between 0.4 and 1.4 M⊙, with Porb = 1 d. Bottom right: time evolution of the corresponding tidal quality factor. The colored squares correspond to the ZAMS and the colored circles to the TAMS in each model. Double lines indicate the presence of a convective core. In this configuration, wave braking is unlikely to occur.
Current usage metrics show cumulative count of Article Views (full-text article views including HTML views, PDF and ePub downloads, according to the available data) and Abstracts Views on Vision4Press platform.
Data correspond to usage on the plateform after 2015. The current usage metrics is available 48-96 hours after online publication and is updated daily on week days.
Initial download of the metrics may take a while.