Fig. 5
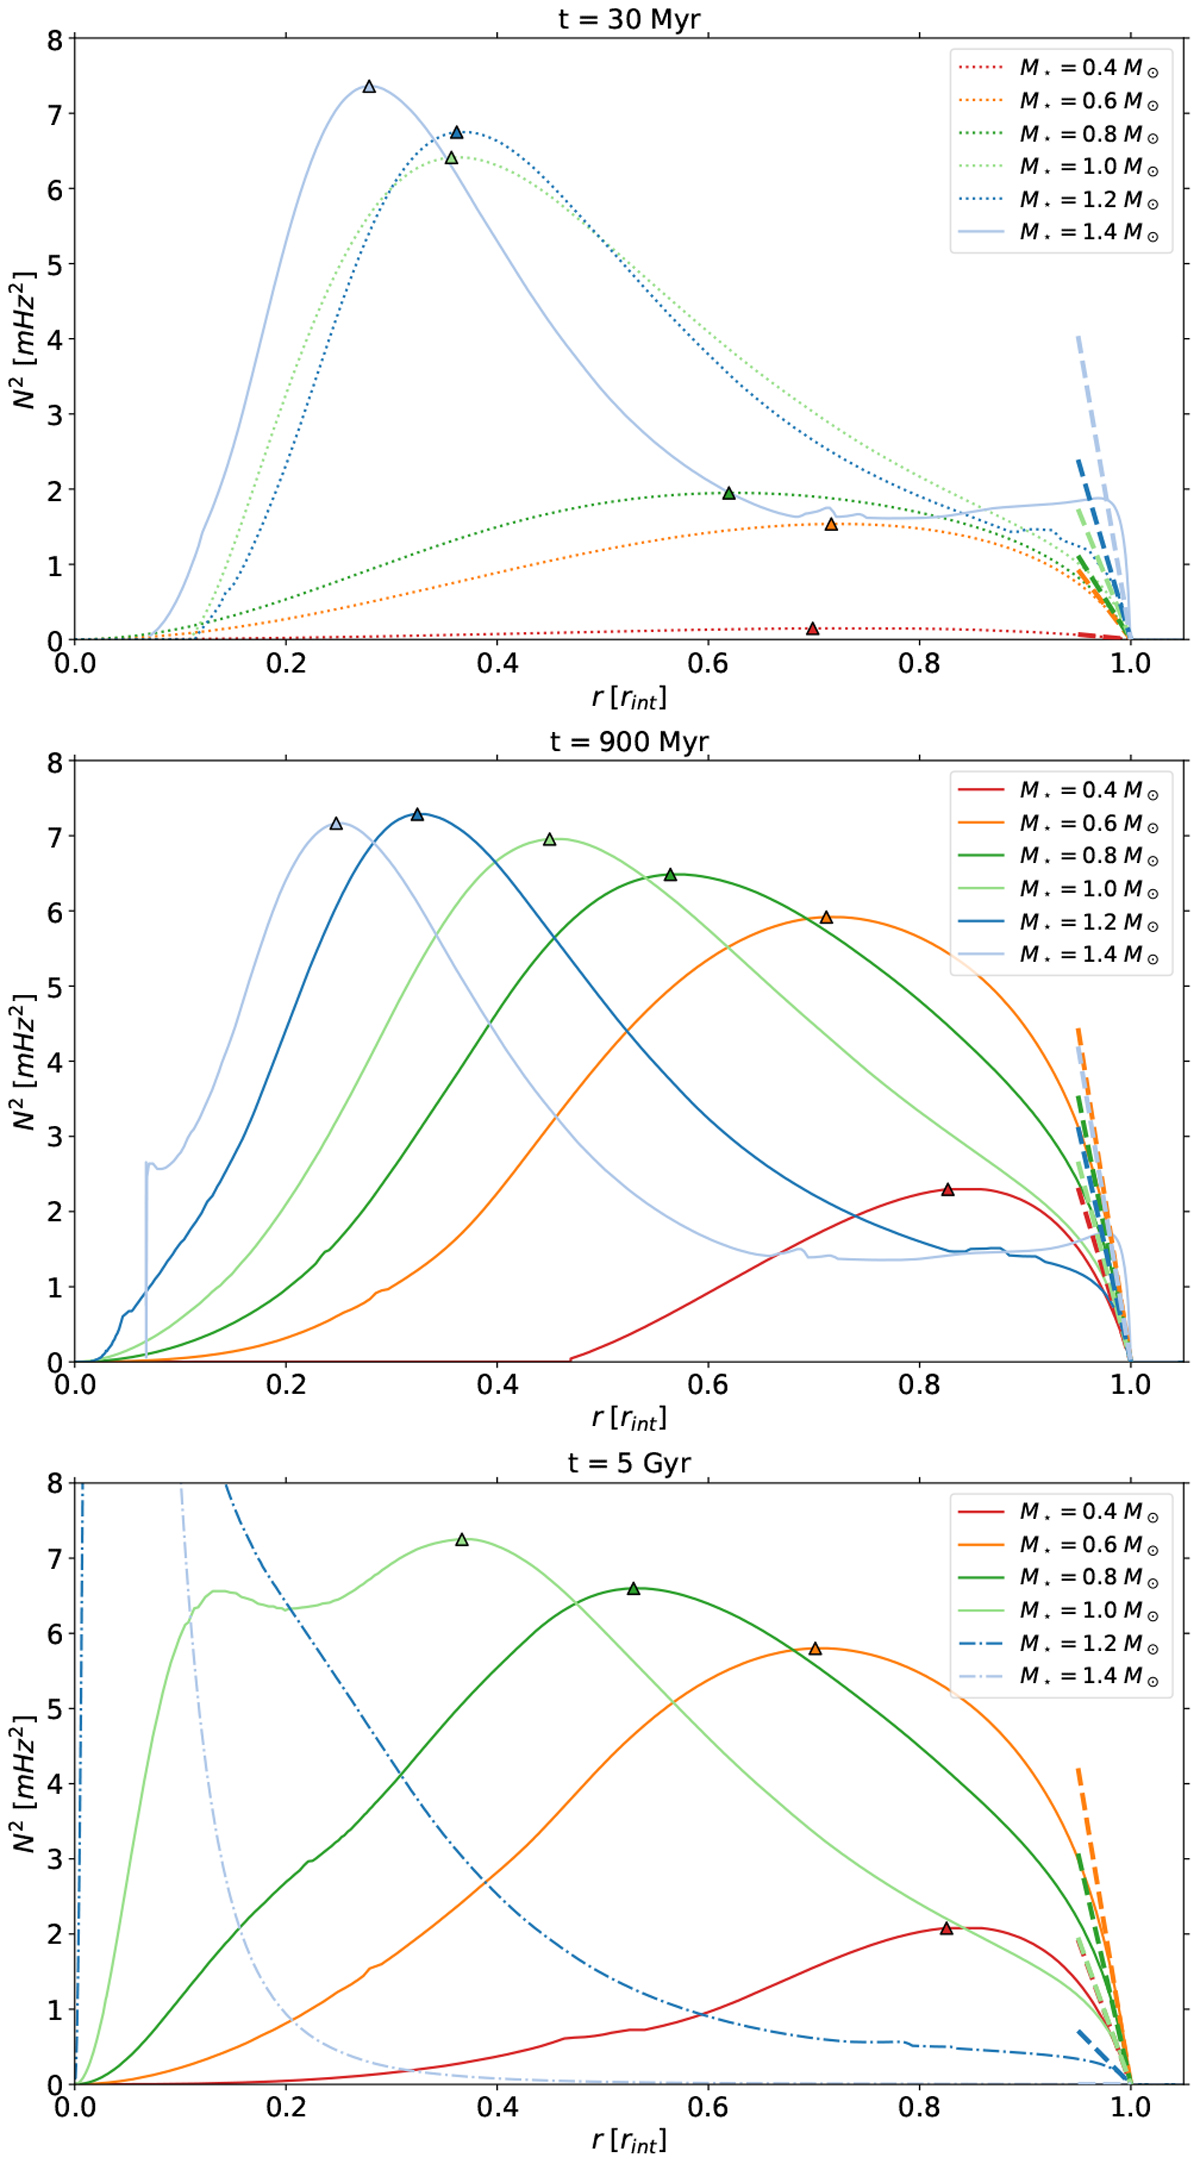
Brunt–Väisälä frequency profiles as a function of the distance to the center of the star, normalized to the radius of its radiative zone, at 30 Myr (top panel), 900 Myr (middle panel), and 5 Gyr (bottom panel). The dotted profiles are situated in the PMS, the plain lines in the MS, and the dash-dotted lines in the post-MS phase. The colors correspond to the same stellar masses as in Fig. 4. The dashed lines correspond to the tangents to the N2 profiles at the interface. The triangles indicate the position of the maximum Brunt–Väisälä frequency.
Current usage metrics show cumulative count of Article Views (full-text article views including HTML views, PDF and ePub downloads, according to the available data) and Abstracts Views on Vision4Press platform.
Data correspond to usage on the plateform after 2015. The current usage metrics is available 48-96 hours after online publication and is updated daily on week days.
Initial download of the metrics may take a while.