Fig. 2
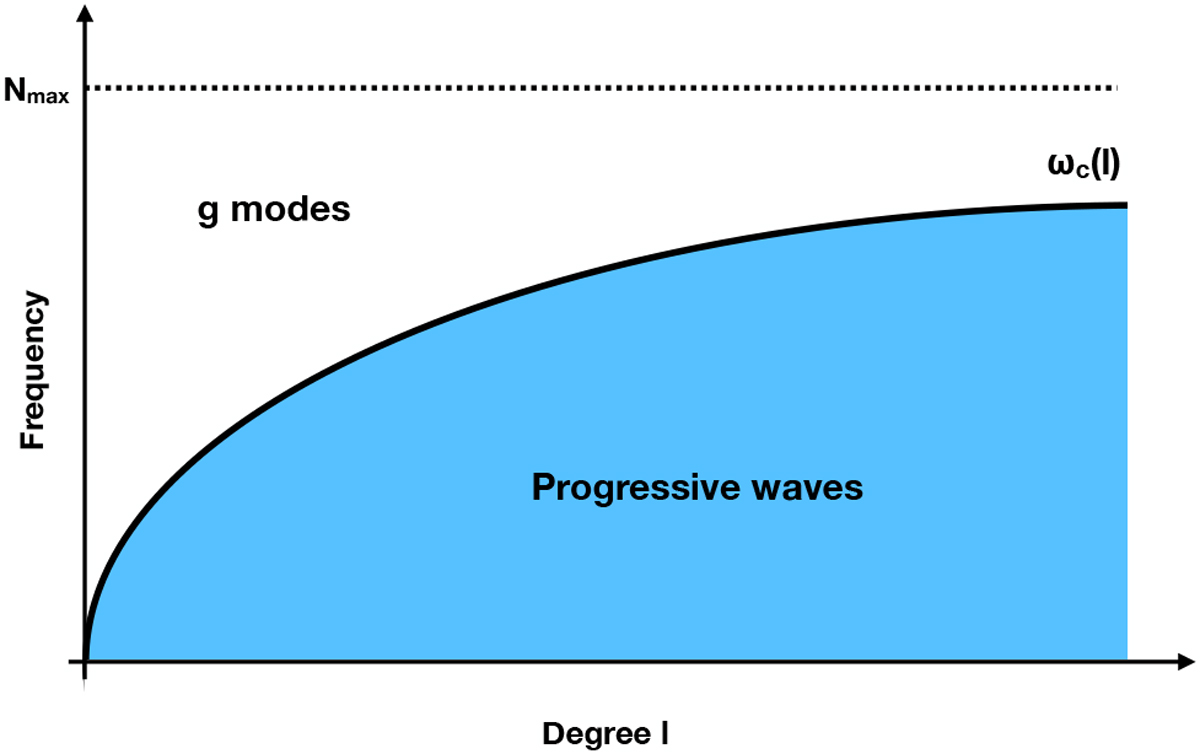
Nature of internal gravity waves as a function of degree l and frequency. The dashed black line corresponds to the maximum value of the Brunt–Väisälä frequency Nmax in the radiative zone. The black line corresponds to the cutoff frequency ωc as a functionof the degree, marking the separation between standing g-modes (in white, above) and progressive internal gravity waves (in blue, below).
Current usage metrics show cumulative count of Article Views (full-text article views including HTML views, PDF and ePub downloads, according to the available data) and Abstracts Views on Vision4Press platform.
Data correspond to usage on the plateform after 2015. The current usage metrics is available 48-96 hours after online publication and is updated daily on week days.
Initial download of the metrics may take a while.