Open Access
Fig. 1
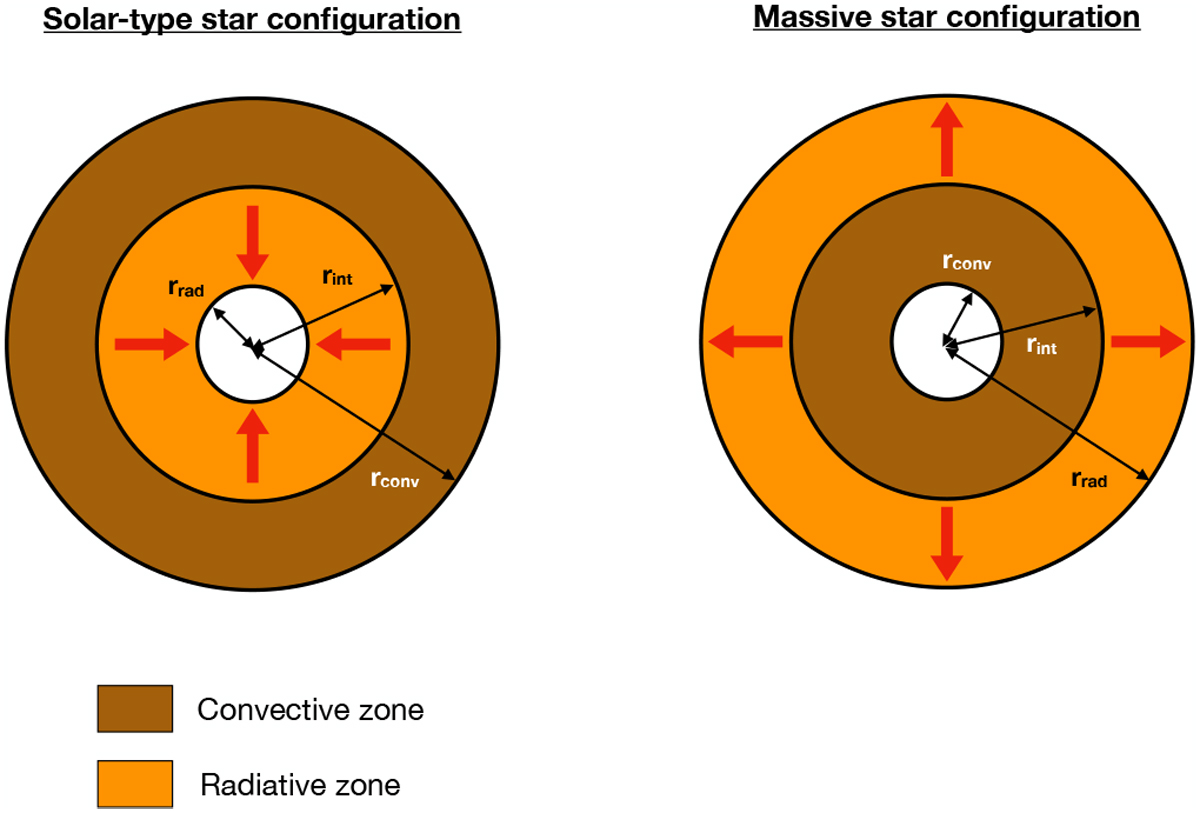
Configurations of the radiative and convective spherical shells in our work. In brown we show the convective layer. In orange we plot the radiative layer. The red arrows represent the energy flux carried by tidal gravity waves.
Current usage metrics show cumulative count of Article Views (full-text article views including HTML views, PDF and ePub downloads, according to the available data) and Abstracts Views on Vision4Press platform.
Data correspond to usage on the plateform after 2015. The current usage metrics is available 48-96 hours after online publication and is updated daily on week days.
Initial download of the metrics may take a while.