Fig. B.2.
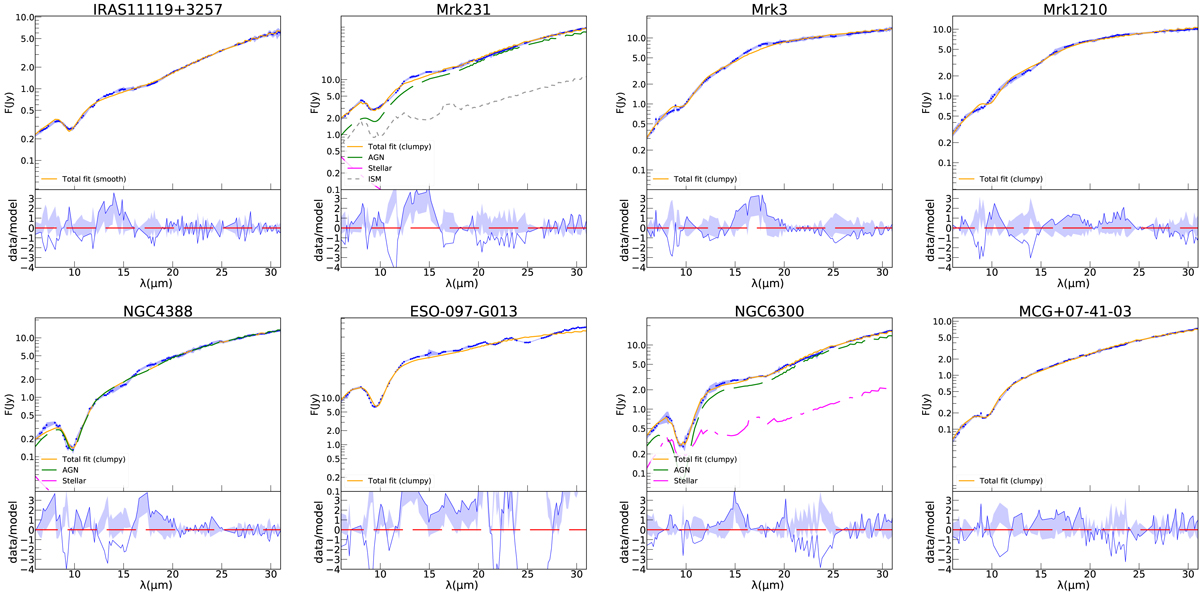
Unfolded spectra of I1119+3257, Mrk 231, Mrk 3, Mrk 1210, NGC 4388, ESO-097-G013, NGC 6300, and MCG+07-41-03. The solid orange lines are the best fit obtained from the smooth baseline model at mid-IR wavelengths. Spitzer spectrum is displayed with blue points. The green, pink and gray dotted lines show the AGN, stellar, and ISM components, respectively. The lower panels display the residuals between data and the best-fit model.
Current usage metrics show cumulative count of Article Views (full-text article views including HTML views, PDF and ePub downloads, according to the available data) and Abstracts Views on Vision4Press platform.
Data correspond to usage on the plateform after 2015. The current usage metrics is available 48-96 hours after online publication and is updated daily on week days.
Initial download of the metrics may take a while.