Fig. 9
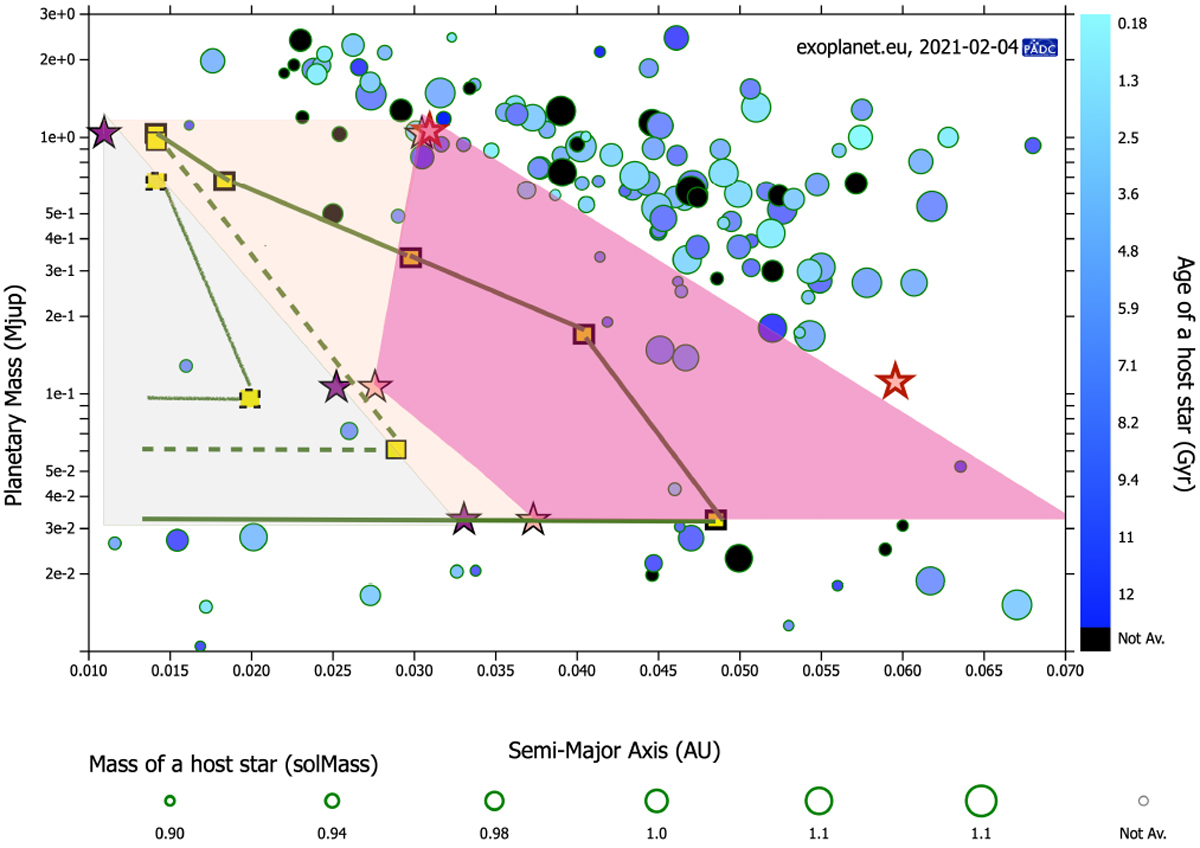
Data points are masses (Msin i) and semi-major axis for confirmed planets orbiting stars with masses between 0.9 and 1.1 M⊙. The light-grey shaded area indicates the Neptunian desert zone after 40 Myr as predicted by our models for our slow-rotating case (Vini = 4 km s−1). The light pink zone shows the enlargement of that Neptunian desert region just after 40 Myr as predicted by our models for our moderate rotating case (Vini = 40 km s−1). The magenta shaded area shows the enlargement of that zone after 300 Myr. For comparison, also plotted are the lines corresponding to the minimum survival masses of planets with core masses of 0.03 MJup (solid line), 0.06 MJup (dashed line) and 0.09 MJup (fuzzy line) at an age of 10 Gyr obtained by Kurokawa & Nakamoto (2014). The corresponding core masses are shown by horizontal lines.
Current usage metrics show cumulative count of Article Views (full-text article views including HTML views, PDF and ePub downloads, according to the available data) and Abstracts Views on Vision4Press platform.
Data correspond to usage on the plateform after 2015. The current usage metrics is available 48-96 hours after online publication and is updated daily on week days.
Initial download of the metrics may take a while.