Fig. 5
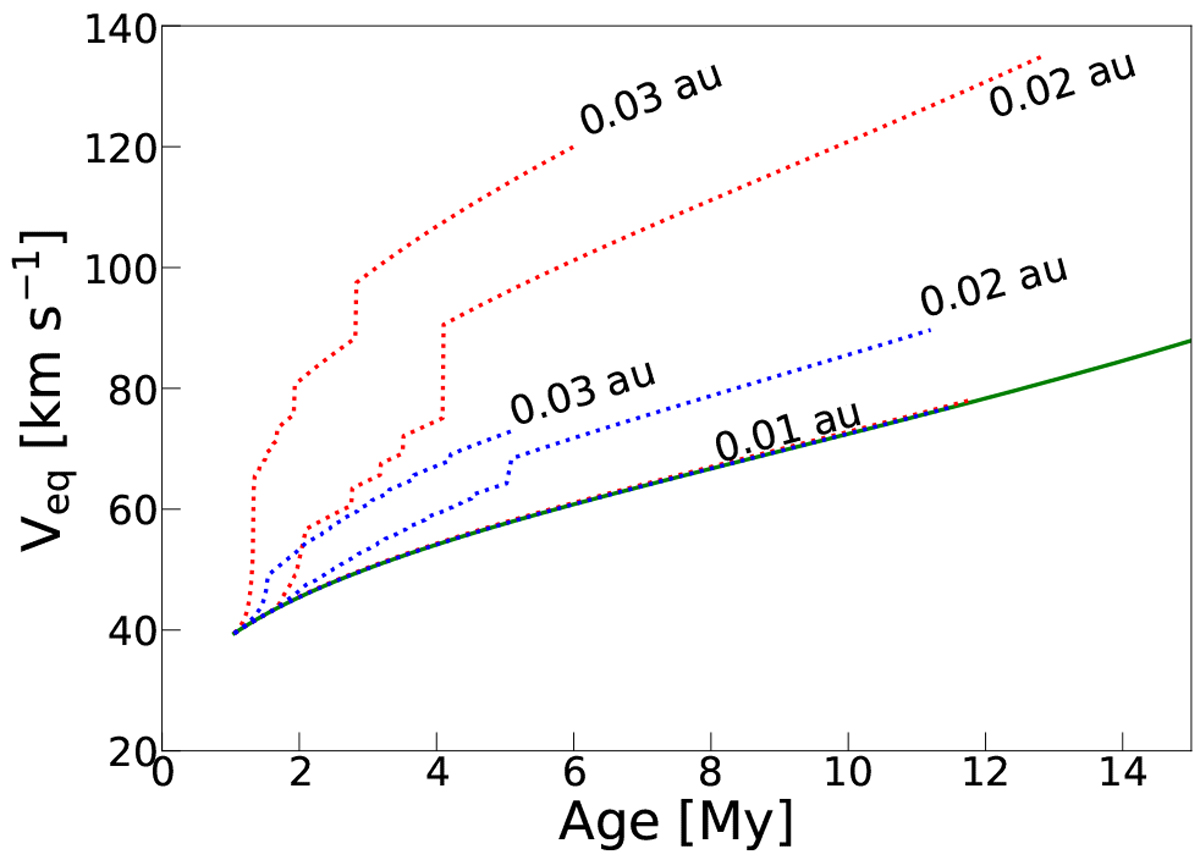
Time evolution of the stellar surface rotation velocity when the orbits of planets with 10 (blue dotted curves) and 30 MJup (red dotted curves) shrink, compared to the surface velocity evolution of the star without any planet (continuous green curve). Three dotted curves are shown per planet for three initial distances from the star: the lower curves correspond to 0.01 au, and these follow the same path whatever the mass of the planet, coinciding with the green curve. The middle and upper curves correspond to initial distances equal to 0.02 and 0.03 au, respectively.
Current usage metrics show cumulative count of Article Views (full-text article views including HTML views, PDF and ePub downloads, according to the available data) and Abstracts Views on Vision4Press platform.
Data correspond to usage on the plateform after 2015. The current usage metrics is available 48-96 hours after online publication and is updated daily on week days.
Initial download of the metrics may take a while.