Fig. 4
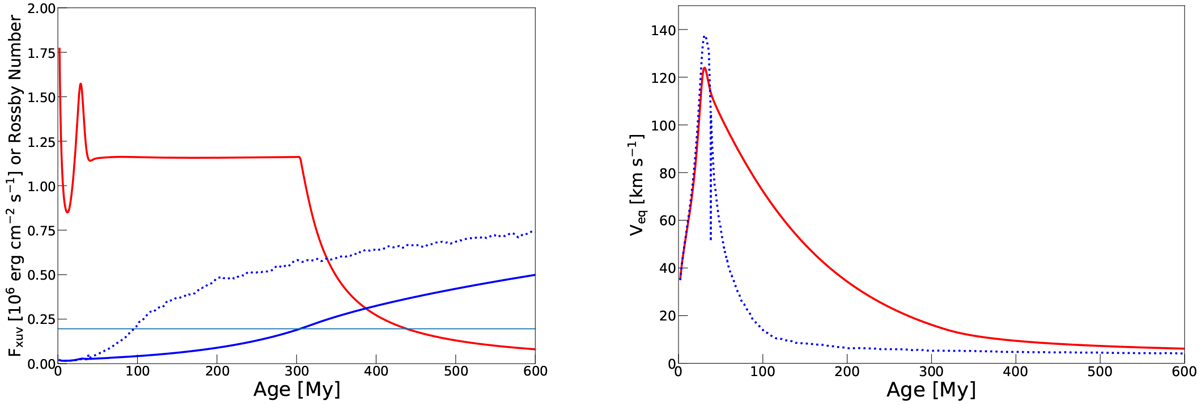
Evolution of the XUV irradiation flux and of the Rossby number. Left panel: red continuous line shows the evolution as a functionof time of the XUV flux on the planet beginning its evolution at a distance of 0.05 au. The blue continuous line shows the evolution of the Rossby number obtained from the solid body stellar rotation model. The dotted blue line is the Rossby number obtained from the differentially rotating model. Below the horizontal line at 0.196, the X-ray luminosity is a constant fraction (0.00074) of the bolometric luminosity. When the curve is above the horizontal line, the X-ray luminosity decreases rapidly as the Rossby number increases (see text). Right panel: evolution of the surface velocity of the 1 M⊙ model. The red line shows the surface velocity assuming solid body rotation. The blue line is the surface velocity obtained from the model used in Rao et al. (2018) where differential rotation occurs due to the internal angular momentum redistribution resulting from shear instability and meridional currents.
Current usage metrics show cumulative count of Article Views (full-text article views including HTML views, PDF and ePub downloads, according to the available data) and Abstracts Views on Vision4Press platform.
Data correspond to usage on the plateform after 2015. The current usage metrics is available 48-96 hours after online publication and is updated daily on week days.
Initial download of the metrics may take a while.