Fig. 3
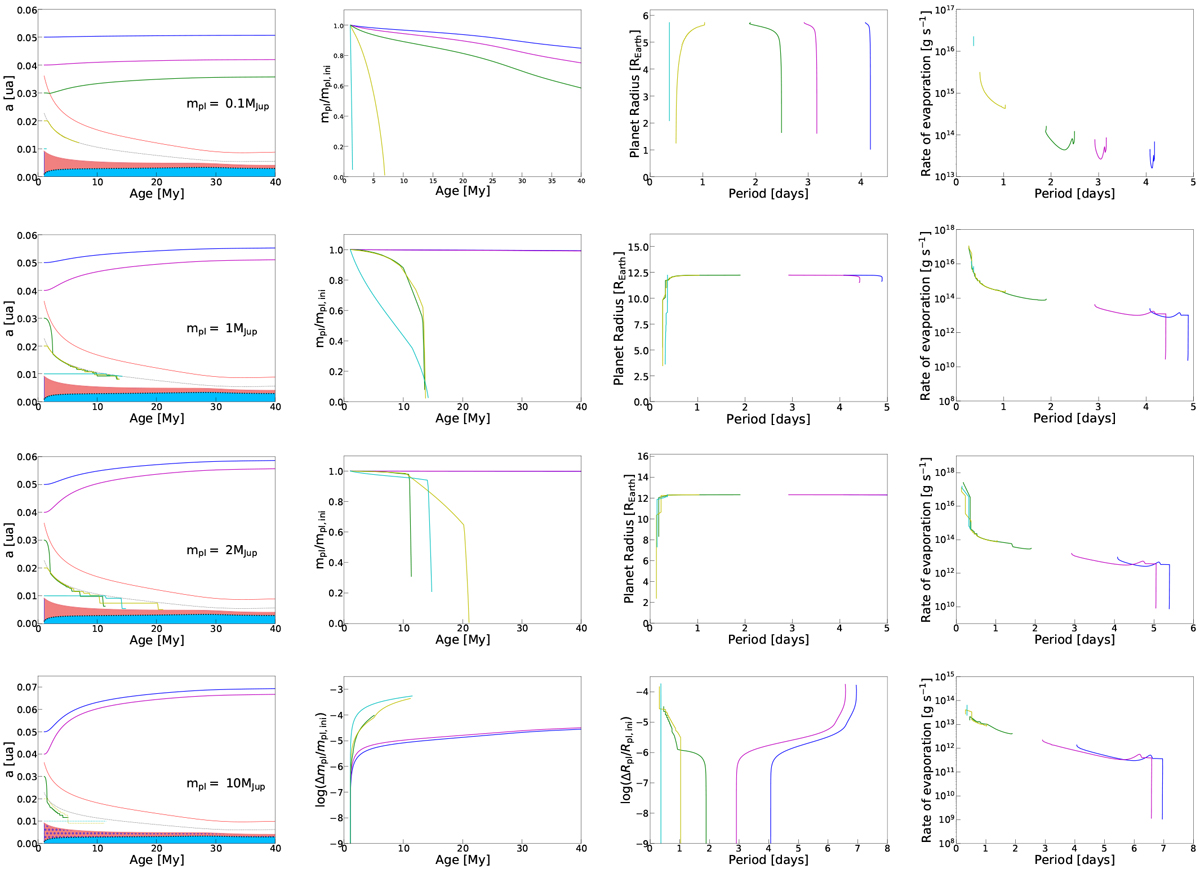
Evolution for a given planetary mass and for different initial radii of the orbit of the orbital distance as a function of time (first column panel), of the planetary mass as a function of time (second column), of the planetary radius as a function of the orbital period (third column), and of the evaporation rate as a function of orbital period (fourth column). Identical colors in a set of row panels correspond to models with the same initial distance to the star (see the left panel in each row). We note that the panels of the fourth row in the second and third column have a different ordinate.
Current usage metrics show cumulative count of Article Views (full-text article views including HTML views, PDF and ePub downloads, according to the available data) and Abstracts Views on Vision4Press platform.
Data correspond to usage on the plateform after 2015. The current usage metrics is available 48-96 hours after online publication and is updated daily on week days.
Initial download of the metrics may take a while.