Fig. 2
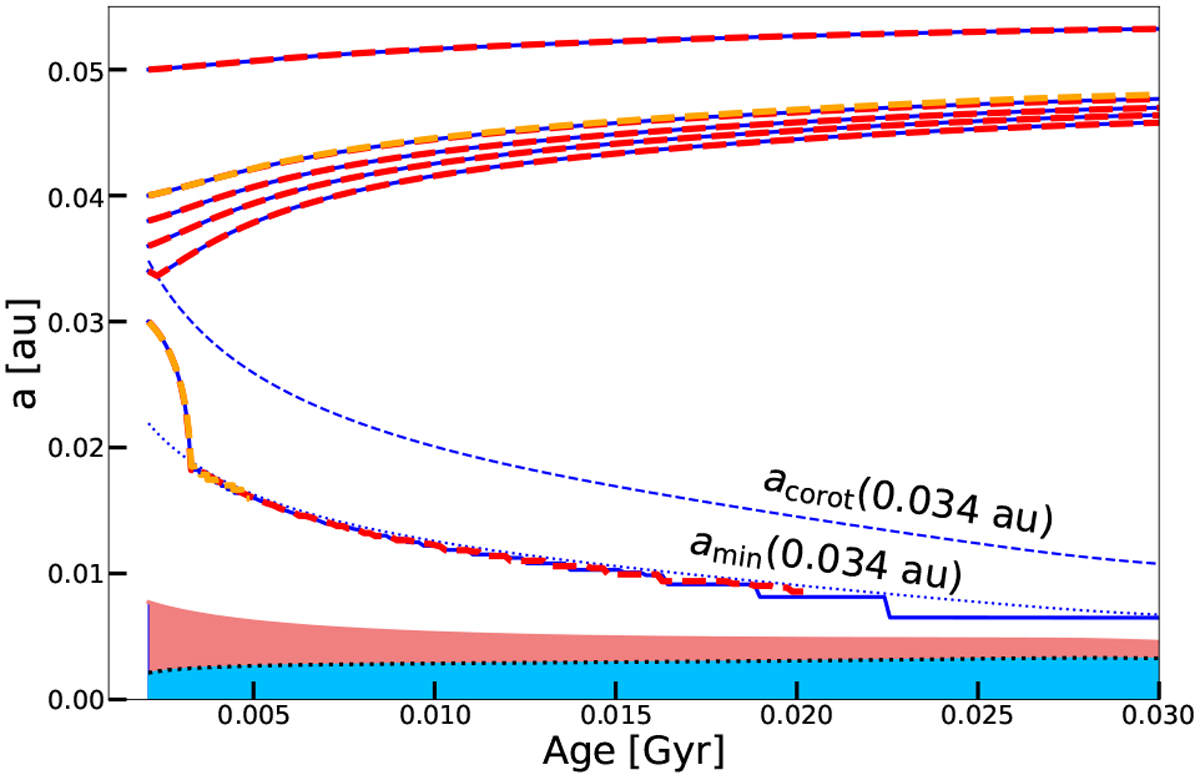
Evolution as a function of time of the orbits of 1 MJup mass planetsaround a 1 M⊙ star, obtained using different approaches. The blue continuous lines are obtained in the present work by switching off the planetary evaporation process. The red dashed lines are obtained switching on the evaporation process. The orange dashed lines (only two cases shown) are the orbits obtained in Rao et al. (2018). The blue dashed and dotted lines show respectively, the corotation radius (acorot) and the critical distance below which dynamical tides are no longer active (amin). They are obtained for the orbit beginning its evolution at a distance equal to 0.034 au. The upper-limit of the pink zone corresponds to the radius of the star in au. Its lower limit shows the radius at the base of the stellar convective envelope. The blue zone indicates the size of the stellar radiative interior.
Current usage metrics show cumulative count of Article Views (full-text article views including HTML views, PDF and ePub downloads, according to the available data) and Abstracts Views on Vision4Press platform.
Data correspond to usage on the plateform after 2015. The current usage metrics is available 48-96 hours after online publication and is updated daily on week days.
Initial download of the metrics may take a while.