Fig. B.1
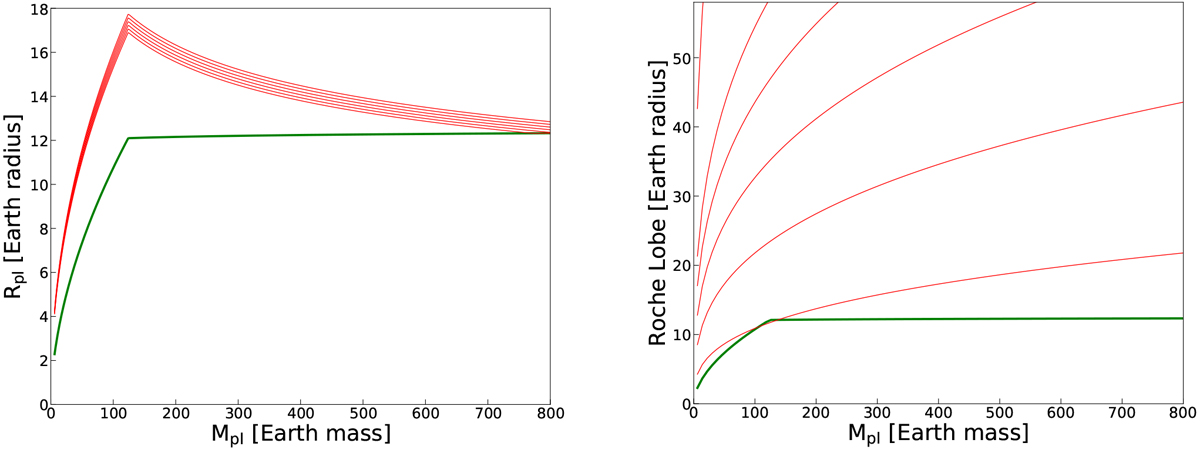
Variation of the planetary radius and of the Roche lobe as a function of the planetary mass. Left panel: variation of the planetary radius as a function of the planetary mass (green curve; see text). The red curves indicate the effective radius accounting for the fact the atmosphere of the planet can be inflated. From bottom to top, the curves corresponds to values of the XUV flux between 104.5 and 105.5 in steps of 0.2 dex. These XUV fluxes corresponds to XUV luminosities equal to 10−3 L⊙ and orbital distances between about 0.05 and 0.2 au. Right panel: variation of the Roche lobe as a function of the planetary mass (red curves) compared to the planetary radius (thick green curve). The red curves corresponds to distances between the planet and the star equal to 0.01, 0.02, 0.03, 0.04, 0.05, and 0.1,au, from bottom to top. The mass of the star is 1 M⊙.
Current usage metrics show cumulative count of Article Views (full-text article views including HTML views, PDF and ePub downloads, according to the available data) and Abstracts Views on Vision4Press platform.
Data correspond to usage on the plateform after 2015. The current usage metrics is available 48-96 hours after online publication and is updated daily on week days.
Initial download of the metrics may take a while.