Fig. A.1
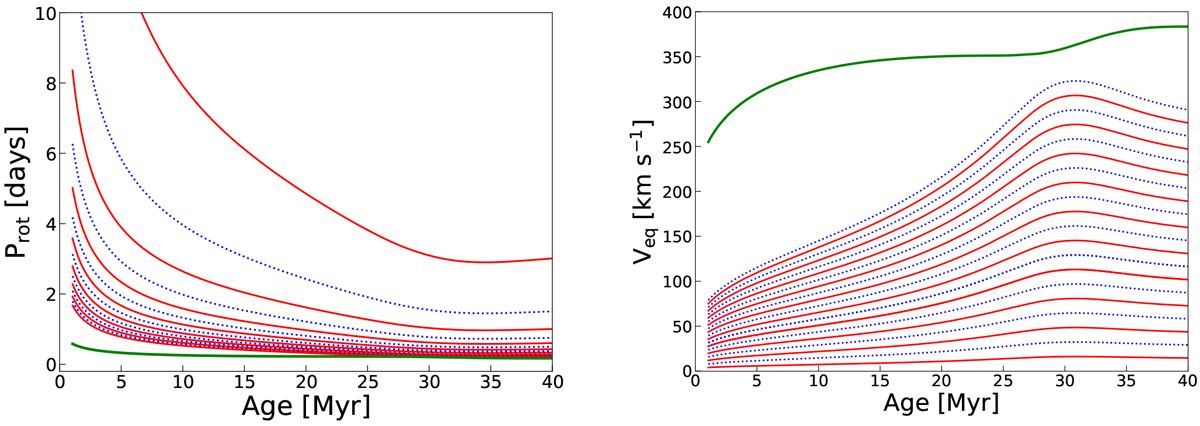
Evolution of the rotation period (left panel) and of the surface velocity (right panel) for an isolated 1 M⊙ stellar model during the PMS phase and the very early MS phase for different values of the initial rotation. The green line shows respectively the critical period (left panel) and the critical velocity (right panel). We note that the bottom line in the left panel corresponds to the upper line in the right panel.
Current usage metrics show cumulative count of Article Views (full-text article views including HTML views, PDF and ePub downloads, according to the available data) and Abstracts Views on Vision4Press platform.
Data correspond to usage on the plateform after 2015. The current usage metrics is available 48-96 hours after online publication and is updated daily on week days.
Initial download of the metrics may take a while.