Fig. 1
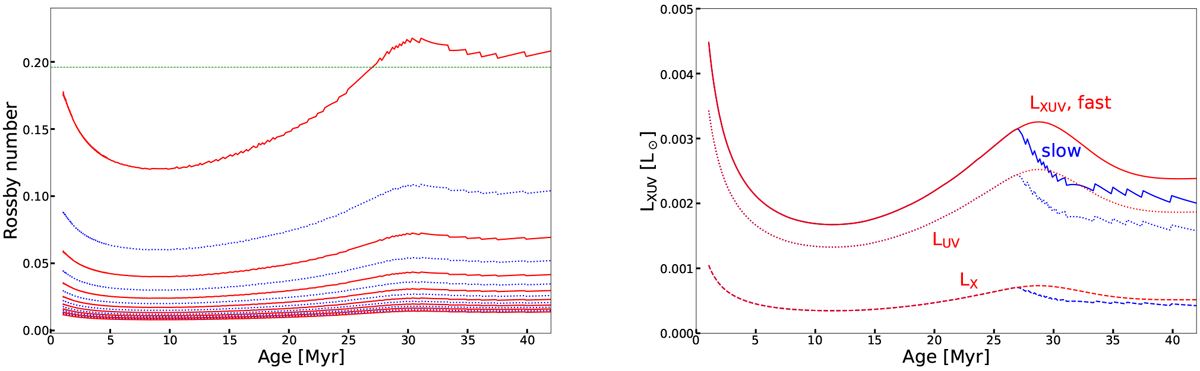
Left panel: evolution of the Rossby number for an isolated 1 M⊙ stellar model during the PMS phase and the very early MS phase for different values of the initial rotation. The initial rotation periods and velocities can be seen in Fig. A.1. The Rossby number corresponding to the slowest initial rotation is the upper curve. Right panel: evolution of the X-ray, EUV luminosities and of their sum for a slow (in blue) and a fast (in red) rotating 1 M⊙ model. The slow and fast rotations correspond, respectively, to the slowest and fastest model shown in Fig. A.1.
Current usage metrics show cumulative count of Article Views (full-text article views including HTML views, PDF and ePub downloads, according to the available data) and Abstracts Views on Vision4Press platform.
Data correspond to usage on the plateform after 2015. The current usage metrics is available 48-96 hours after online publication and is updated daily on week days.
Initial download of the metrics may take a while.