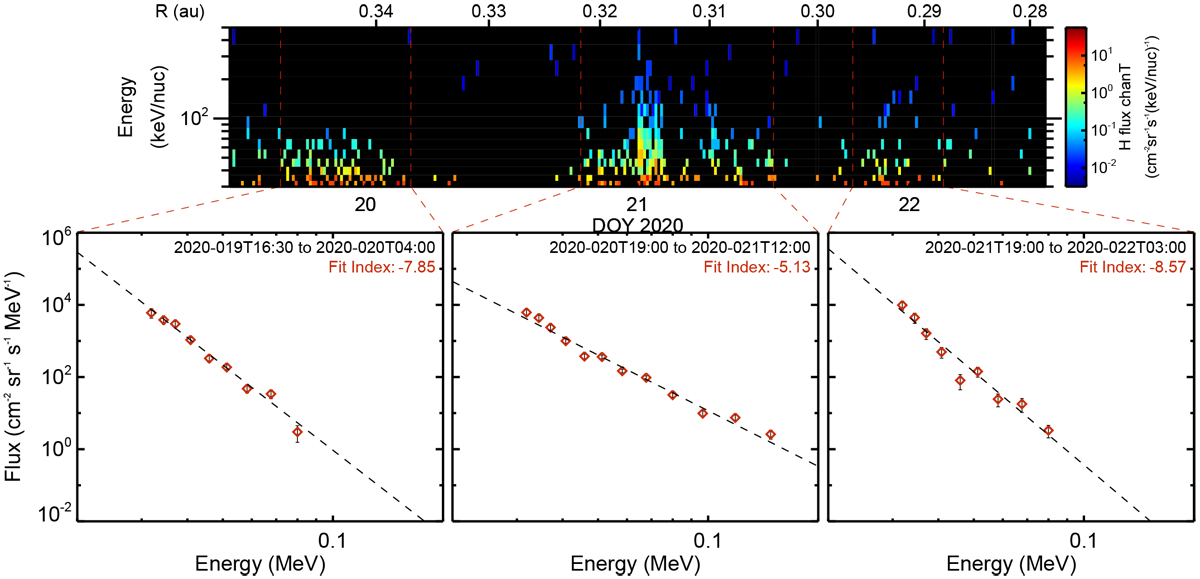
Fig. 5

Energetic particle spectra for three periods during the event, prior to, during and after the CME passage. Each spectrum isfit with a simple power law. Details on spectra computation are included in the appendix. Spectra are more than 99% protons but also include heavier ions in small amounts. The spectrogram data are averaged into 15-min intervals. Spectra uncertainties are statistical.
Current usage metrics show cumulative count of Article Views (full-text article views including HTML views, PDF and ePub downloads, according to the available data) and Abstracts Views on Vision4Press platform.
Data correspond to usage on the plateform after 2015. The current usage metrics is available 48-96 hours after online publication and is updated daily on week days.
Initial download of the metrics may take a while.


