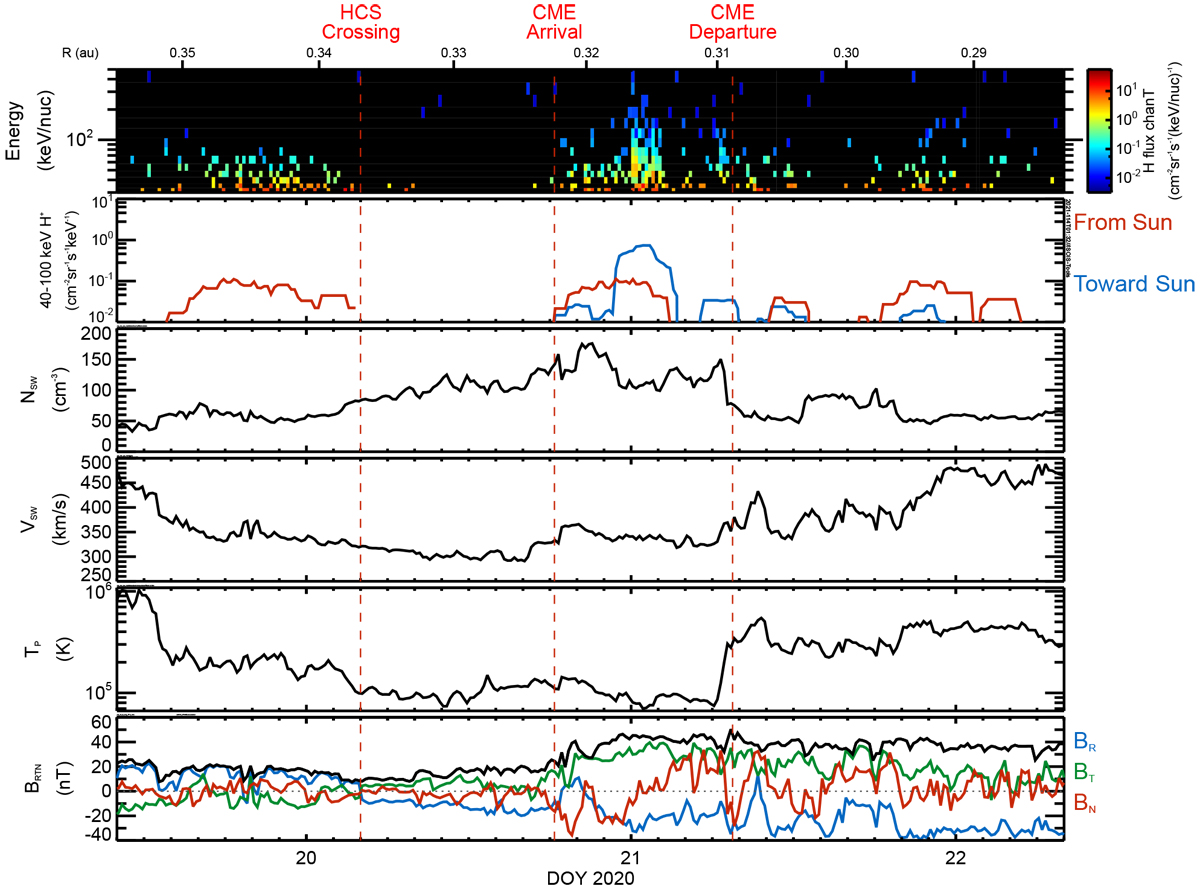
Fig. 3

Overview of the energetic particle, plasma and magnetic field lines during this event. Top panel: spectrogram of the energetic particles, showing signatures of velocity dispersion. Second panel: anisotropy of energetic particles propagating from and toward the Sun. Panels 3–5: plasma conditions as measured by the Solar Wind Electrons Alphas and Protons (SWEAP) Solar Probe Cup (SPC) (Kasper et al. 2016). Bottom panel: magnetic field in Radial, Tangential, Normal (RTN) coordinates (Fränz & Harper 2002), as measured by the FIELDS instrument (Bale et al. 2016). On January 20, we see BR change from positive to negative and BT change from negative to positive, consistent with crossing the heliospheric current sheet. Estimated CME arrival and departure times are shown on the plot, bracketing a low plasma beta period, which is consistent with the passage of a magnetic cloud. Data are averaged into 15-min intervals.
Current usage metrics show cumulative count of Article Views (full-text article views including HTML views, PDF and ePub downloads, according to the available data) and Abstracts Views on Vision4Press platform.
Data correspond to usage on the plateform after 2015. The current usage metrics is available 48-96 hours after online publication and is updated daily on week days.
Initial download of the metrics may take a while.


