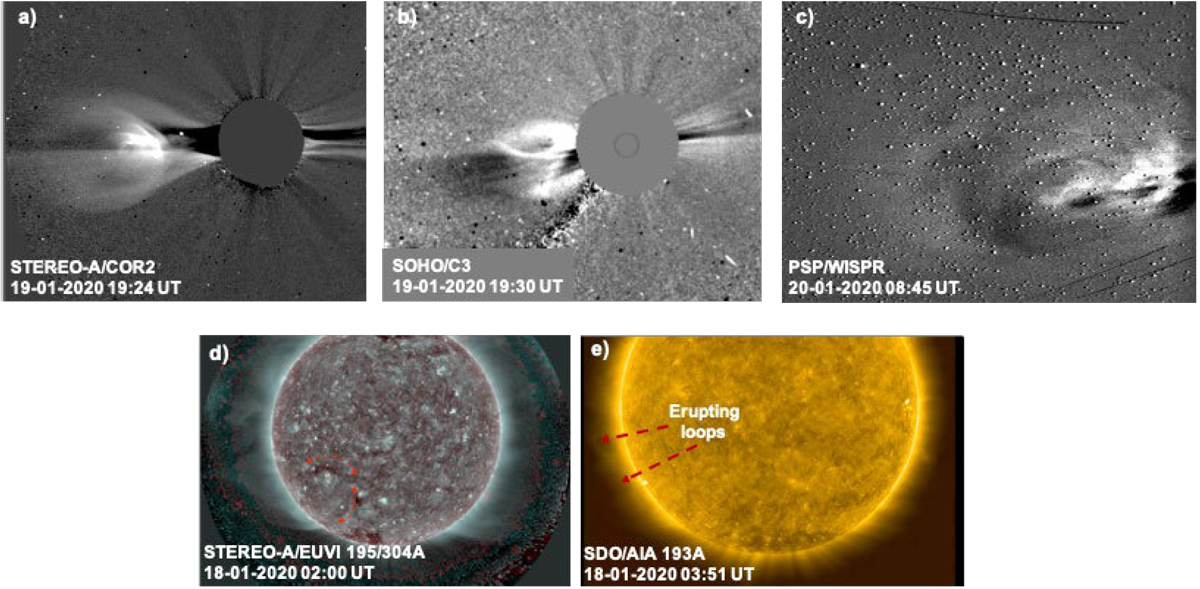
Fig. 2

Remote observations of the January 20 CME and its likely source region. The instruments and times are shown on each panel. The red arrows demarcate the source region in EUVI, based on the erupting loops seen in AIA. The COR2 and C3 are mass images, the WISPR is a running difference image. The EUVI frame is a composite of 195 and 304 Å channel wavelet-enhanced images (Stenborg et al. 2008).
Current usage metrics show cumulative count of Article Views (full-text article views including HTML views, PDF and ePub downloads, according to the available data) and Abstracts Views on Vision4Press platform.
Data correspond to usage on the plateform after 2015. The current usage metrics is available 48-96 hours after online publication and is updated daily on week days.
Initial download of the metrics may take a while.


