Fig. 10
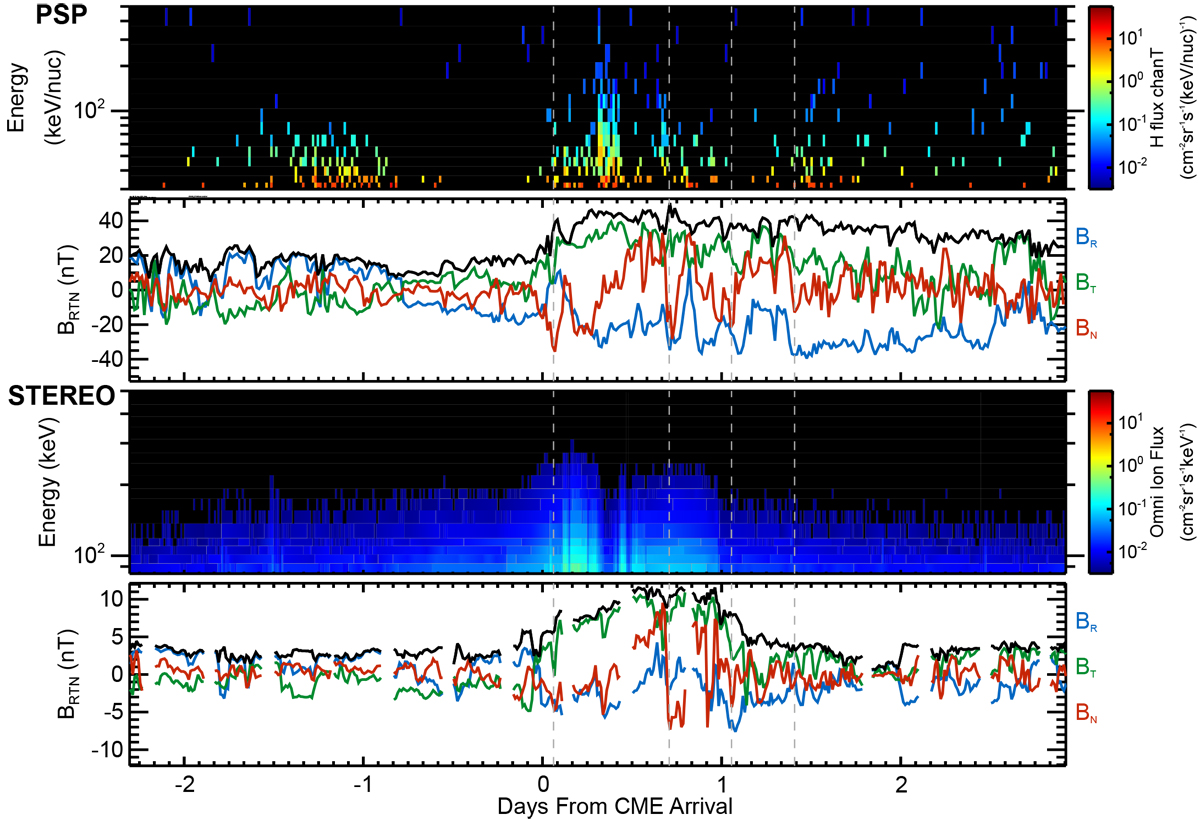
Comparison between PSP and STEREO-A observations of the CME event. The data are lined up at the CME arrival and the PSP data are stretched in time by a factor of 1.3 in an attempt to match the magnetic field features between the two spacecraft. Gray dotted lines are shown to indicate points of reference used to line up these observations. The PSP data are averaged into 15-min intervals and STEREO data are averaged into 5-min intervals.
Current usage metrics show cumulative count of Article Views (full-text article views including HTML views, PDF and ePub downloads, according to the available data) and Abstracts Views on Vision4Press platform.
Data correspond to usage on the plateform after 2015. The current usage metrics is available 48-96 hours after online publication and is updated daily on week days.
Initial download of the metrics may take a while.