Fig. 9
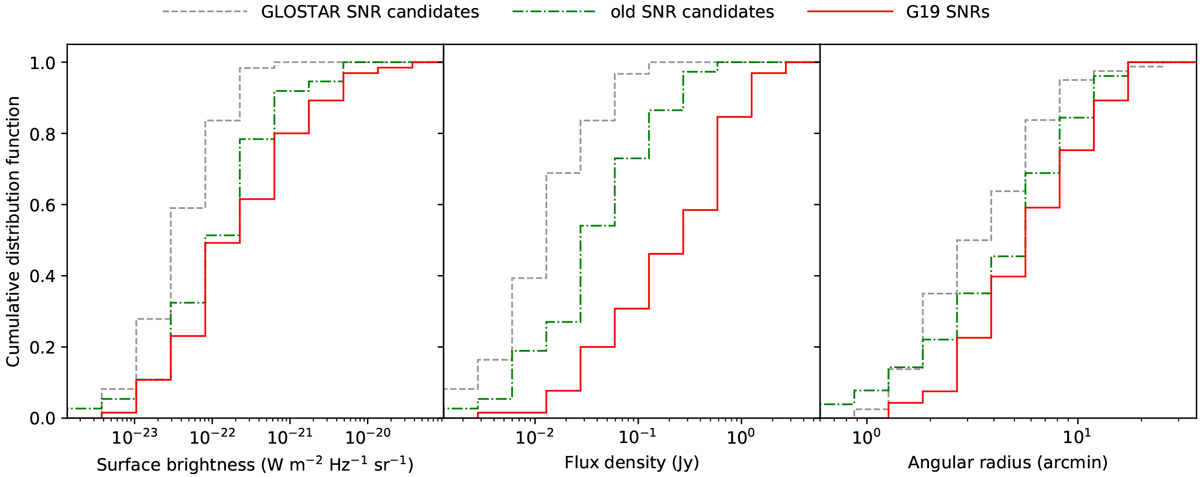
Cumulative distribution functions of average 5.8 GHz surface brightness (left), flux density (middle), and angular radius (right) of G19 SNRs (red), the SNR candidates discovered in earlier studies (green), and the new SNR candidates identified in the GLOSTAR-VLA survey (gray). The average surface brightness is obtained by dividing the flux density by the angular area subtended by the object. All the properties presented here are as measured in the GLOSTAR-VLA data.
Current usage metrics show cumulative count of Article Views (full-text article views including HTML views, PDF and ePub downloads, according to the available data) and Abstracts Views on Vision4Press platform.
Data correspond to usage on the plateform after 2015. The current usage metrics is available 48-96 hours after online publication and is updated daily on week days.
Initial download of the metrics may take a while.