Open Access
Fig. 7
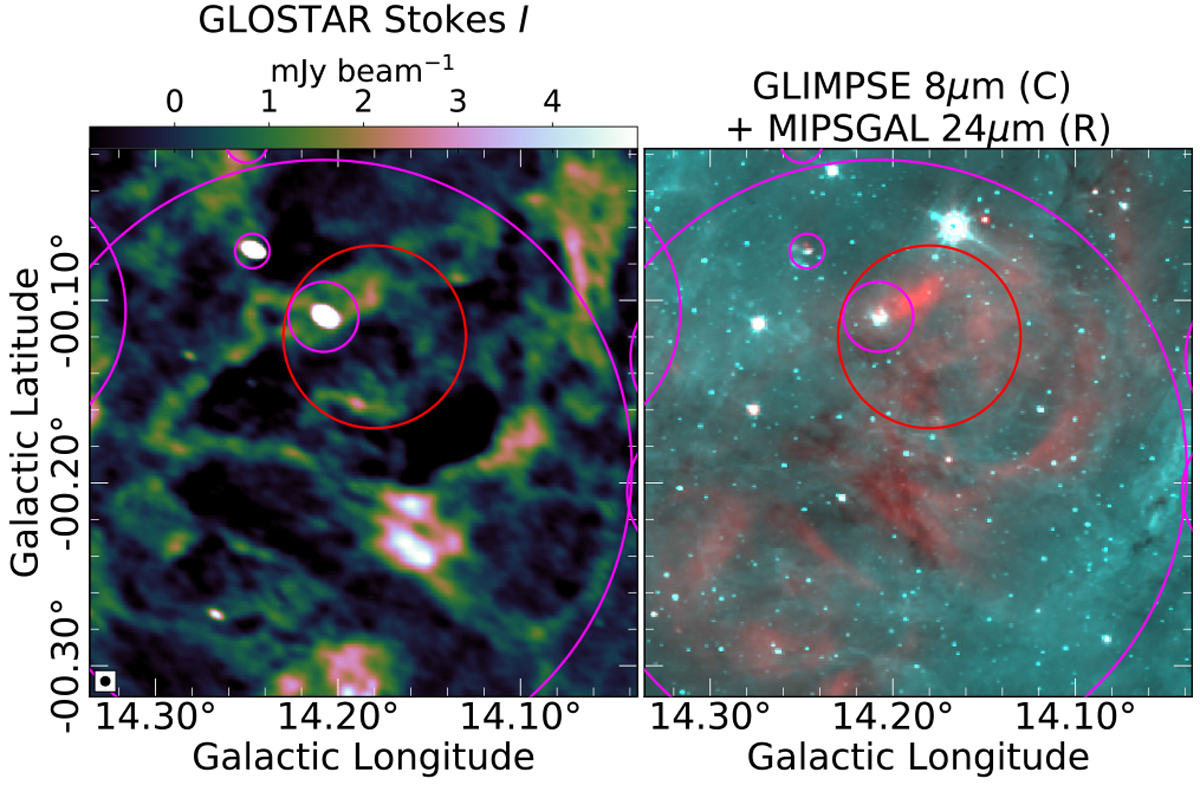
Environment of G19 SNR G14.1−0.1 (encircled in red). The left panel shows the GLOSTAR-VLA data and the right panel shows MIPSGAL 24 μm data in cyan and GLIMPSE 8 μm in red. The supposed shell of G14.1−0.1 is not clearly detected in the GLOSTAR-VLA data.
Current usage metrics show cumulative count of Article Views (full-text article views including HTML views, PDF and ePub downloads, according to the available data) and Abstracts Views on Vision4Press platform.
Data correspond to usage on the plateform after 2015. The current usage metrics is available 48-96 hours after online publication and is updated daily on week days.
Initial download of the metrics may take a while.