Open Access
Fig. 6
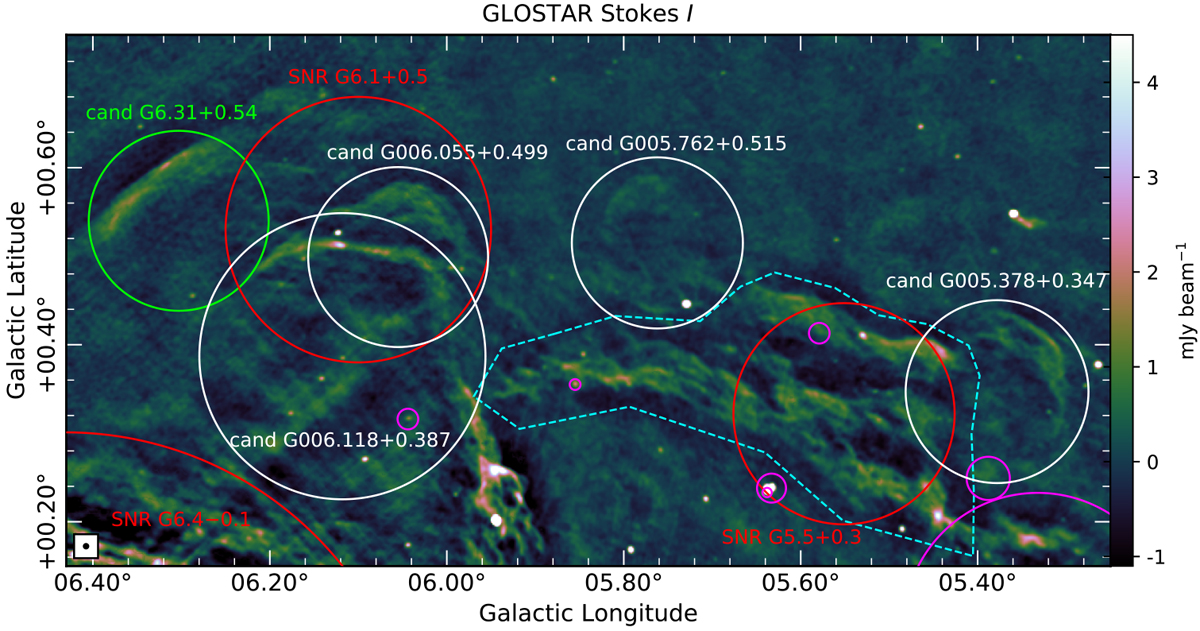
Field of G19 SNRs G5.5+0.3 and G6.1+0.5. The region of G5.5+0.3 defined by Brogan et al. (2006) seems to be a part of a larger structure with no easily recognizable shape (marked with a dashed cyan polygon).
Current usage metrics show cumulative count of Article Views (full-text article views including HTML views, PDF and ePub downloads, according to the available data) and Abstracts Views on Vision4Press platform.
Data correspond to usage on the plateform after 2015. The current usage metrics is available 48-96 hours after online publication and is updated daily on week days.
Initial download of the metrics may take a while.