Open Access
Fig. 4
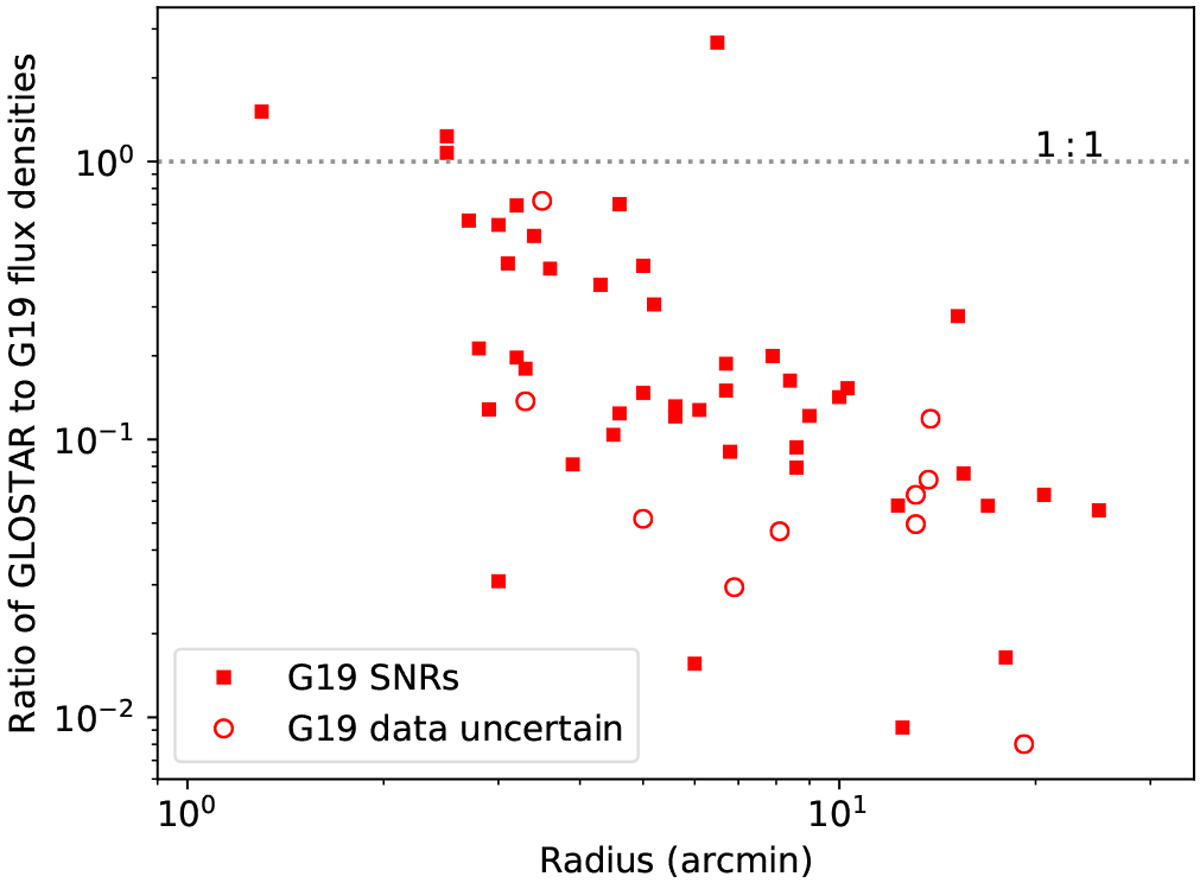
Comparing the flux densities of G19 SNRs measured in the GLOSTAR-VLA 5.8 GHz data and the flux densities reported in the G19 catalog scaled from 1 GHz to 5.8 GHz. Those with uncertain flux densities or spectral indices in the G19 catalog are marked with circles.
Current usage metrics show cumulative count of Article Views (full-text article views including HTML views, PDF and ePub downloads, according to the available data) and Abstracts Views on Vision4Press platform.
Data correspond to usage on the plateform after 2015. The current usage metrics is available 48-96 hours after online publication and is updated daily on week days.
Initial download of the metrics may take a while.