Fig. 3
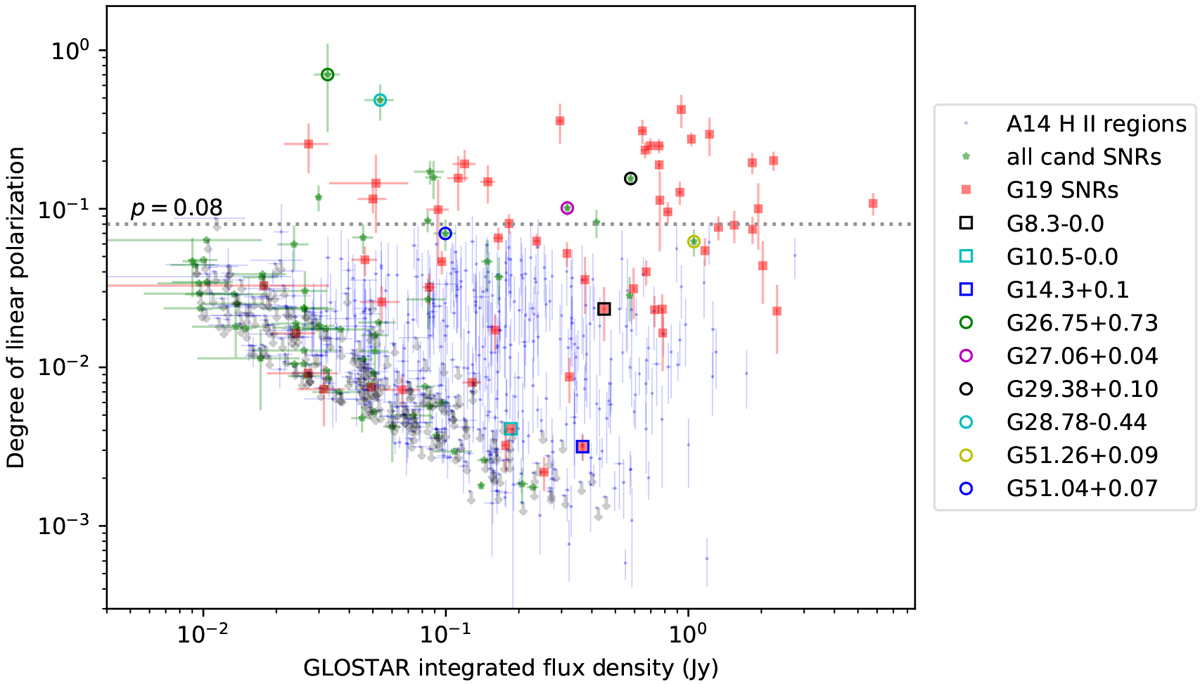
Degree of linear polarization p plotted against flux density for A14 H II regions, G19 SNRs, and SNR candidates brighter than 9 mJy. Objects with upperlimits on the degree of polarization are marked with gray arrows. Some SNR candidates and G19 SNRs discussed in the later sections have been marked for the sake of comparison: open squares represent the misidentified G19 SNRs (see Sect. 4.2.2), and the open circles represent SNR candidates that we confirm as true SNRs (see Sect. 4.5). The lower end of the group of points follows an approximate linear relation due to the nearly constant detection threshold of linearly polarized flux density (~ 300 μJy).
Current usage metrics show cumulative count of Article Views (full-text article views including HTML views, PDF and ePub downloads, according to the available data) and Abstracts Views on Vision4Press platform.
Data correspond to usage on the plateform after 2015. The current usage metrics is available 48-96 hours after online publication and is updated daily on week days.
Initial download of the metrics may take a while.