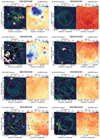
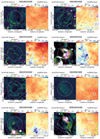
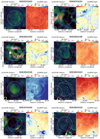
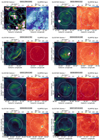
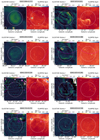
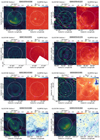
Fig. A.1
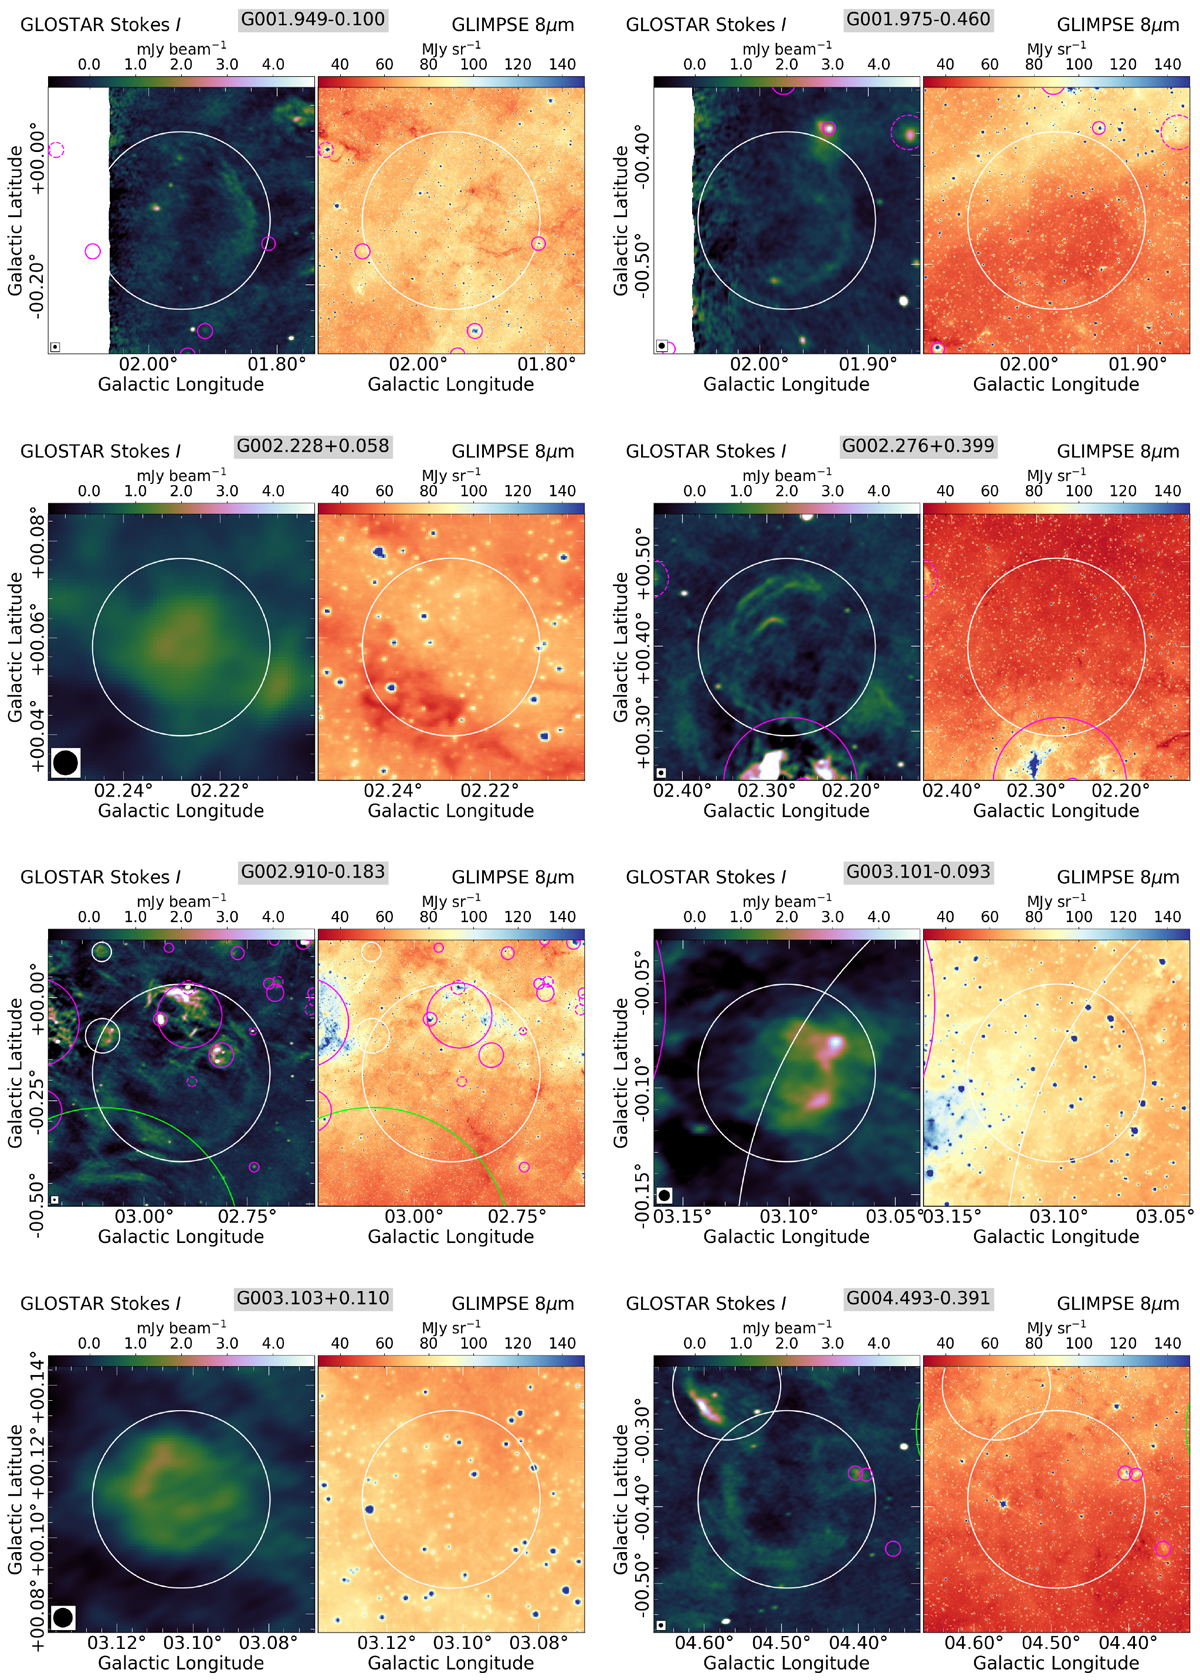
The images of newly identified SNR candidates from the GLOSTAR-VLA data are shown here. The marking scheme is the same as in the text: red circles mark G19 SNRs, solid and dashed magenta circles mark confirmed and candidate HII regions from A14 catalog, green circles mark previously identified SNR candidates, and white circles mark new GLOSTAR SNR candidates. The beam of GLOSTAR-VLA data is shown in the bottom left corner in black. Continued on the following pages.
Current usage metrics show cumulative count of Article Views (full-text article views including HTML views, PDF and ePub downloads, according to the available data) and Abstracts Views on Vision4Press platform.
Data correspond to usage on the plateform after 2015. The current usage metrics is available 48-96 hours after online publication and is updated daily on week days.
Initial download of the metrics may take a while.