Fig. 22
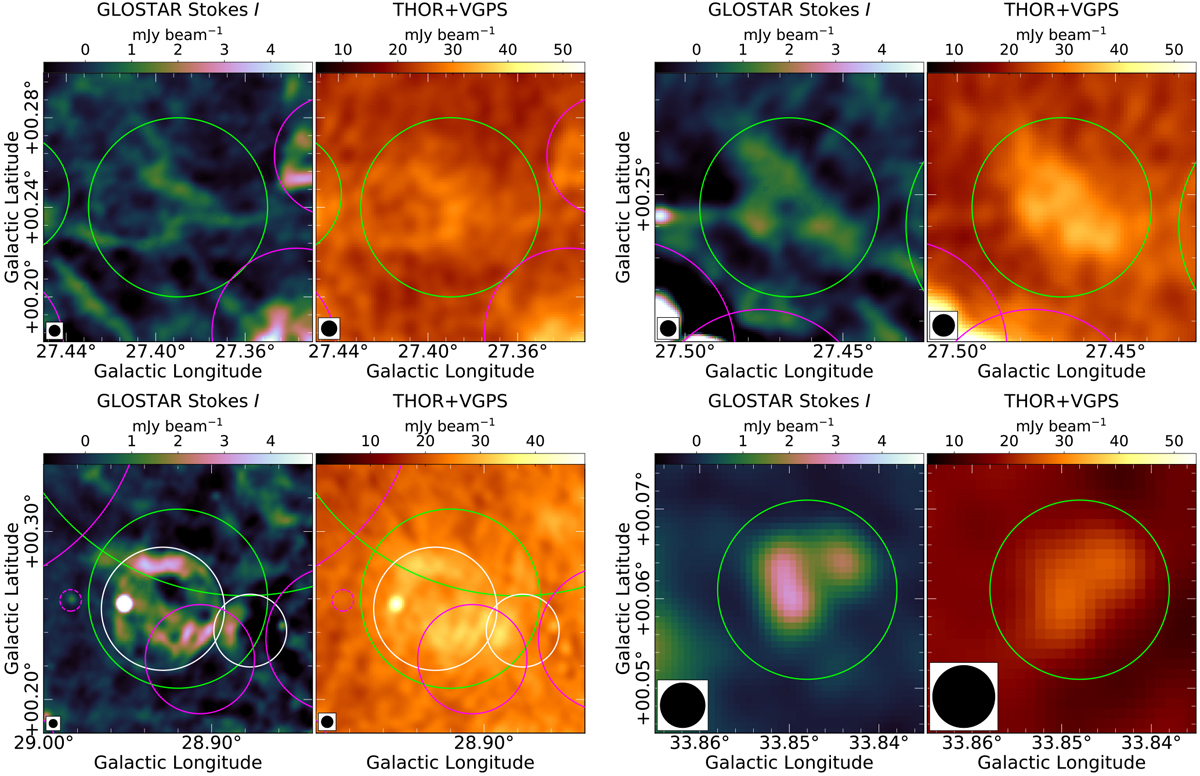
THOR SNR candidates resolved in the GLOSTAR-VLA data: G27.39+0.24 (top left), G27.47+0.25 (top right) G28.92+0.26 (bottom left), and G33.85+0.06 (bottom right). The left panels are the GLOSTAR-VLA data, and the right panels are the THOR+VGPS data. G27.39+0.24 and G27.47+0.25 are filaments mistaken for SNR emission, whereas G28.92+0.26 and G33.85+0.06 contain multiple distinct objects.
Current usage metrics show cumulative count of Article Views (full-text article views including HTML views, PDF and ePub downloads, according to the available data) and Abstracts Views on Vision4Press platform.
Data correspond to usage on the plateform after 2015. The current usage metrics is available 48-96 hours after online publication and is updated daily on week days.
Initial download of the metrics may take a while.