Fig. 2
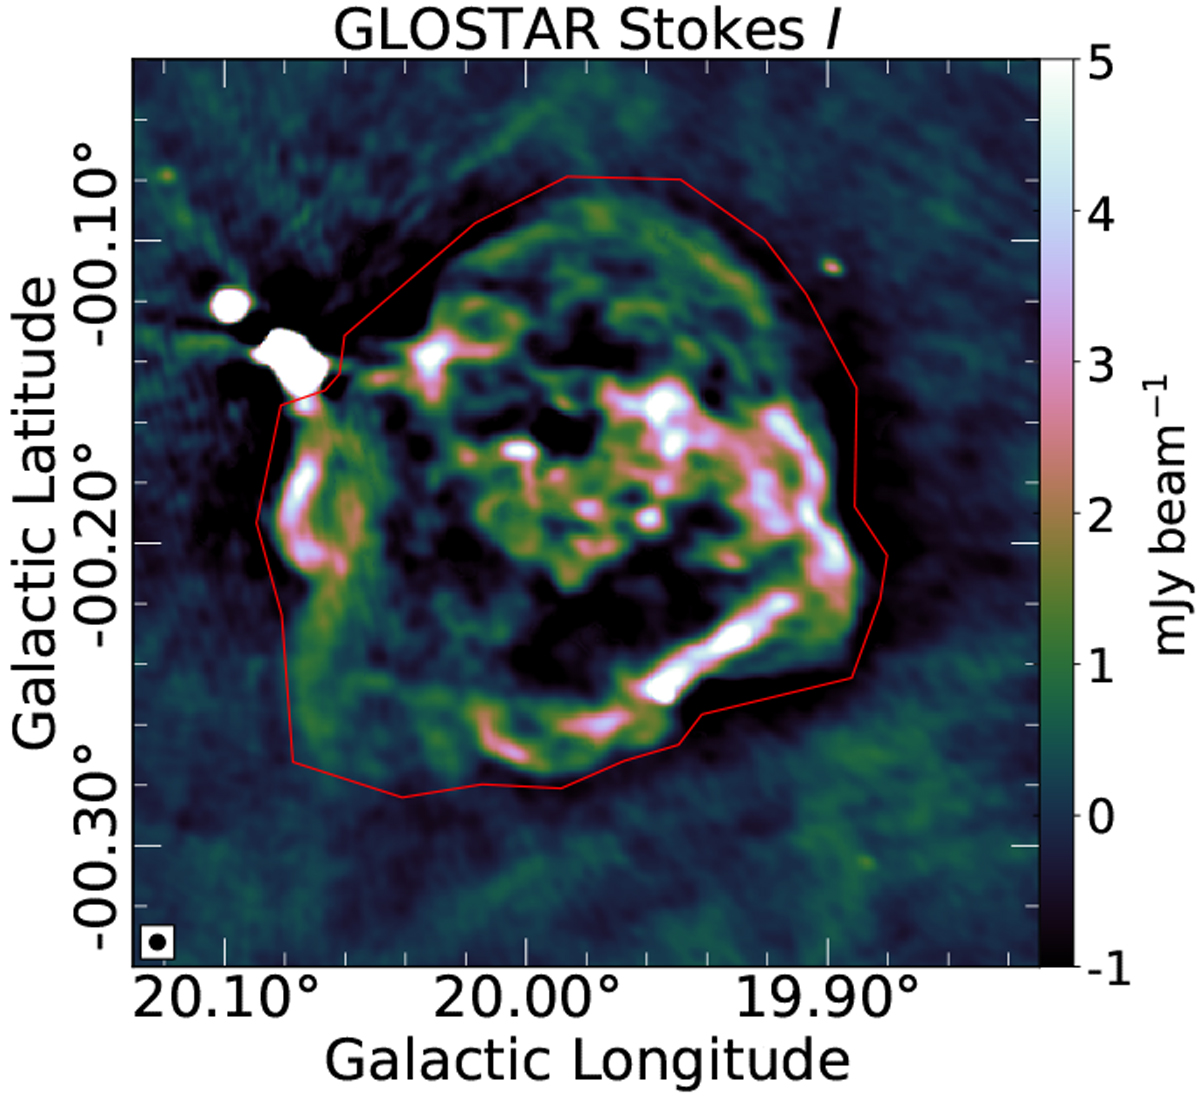
Measuring the integrated flux density of SNR G20.0−0.2. The polygon used to select the region of the SNR is shown in red. As we mask values below the 3σI level, choosing the negative bowls around real emission does not affect our measurement. The regions with compact emission to the northeast of the SNR (near l = 20.09, b = −0.13) are A14 H II regions, and hence excluded.
Current usage metrics show cumulative count of Article Views (full-text article views including HTML views, PDF and ePub downloads, according to the available data) and Abstracts Views on Vision4Press platform.
Data correspond to usage on the plateform after 2015. The current usage metrics is available 48-96 hours after online publication and is updated daily on week days.
Initial download of the metrics may take a while.