Fig. 13
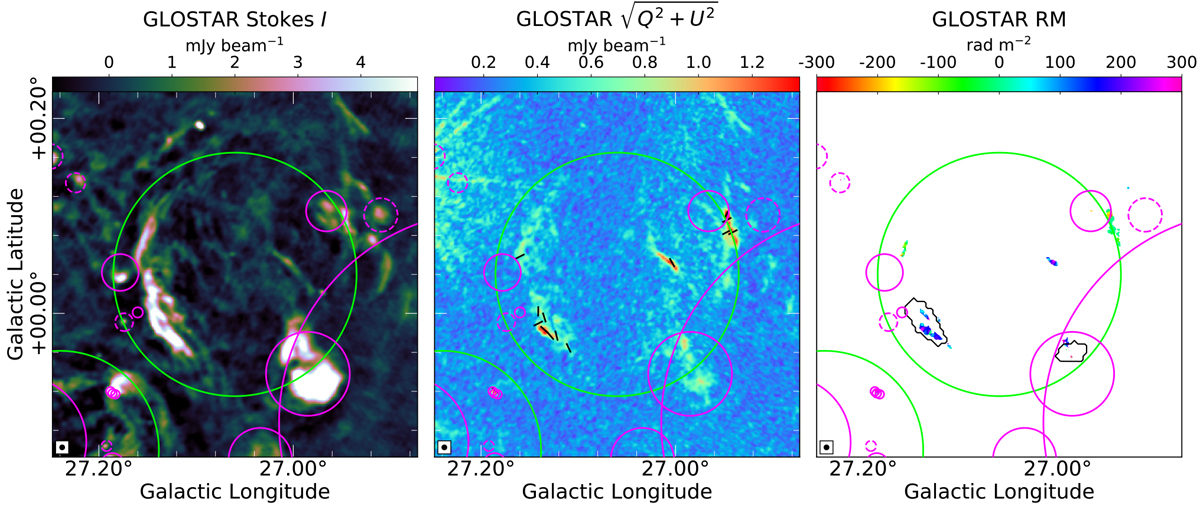
G27.06+0.04. The RMs presented in the right-most panel typically have uncertainties of 30–40 rad m−2. The black contours on the rotation measure map show the regions for which the TIFR GMRT Sky Survey-NRAO VLA Sky Survey (TGSS-NVSS) spectral index was measured. The eastern region (on the arc) and the western region (overlapping with two H II regions) have a similar spectral index of ~ − 0.5. For this andall subsequent figures, the directions of the electric field vector position angles (after accounting for Faraday rotation) are plotted with black lines on the polarization map.
Current usage metrics show cumulative count of Article Views (full-text article views including HTML views, PDF and ePub downloads, according to the available data) and Abstracts Views on Vision4Press platform.
Data correspond to usage on the plateform after 2015. The current usage metrics is available 48-96 hours after online publication and is updated daily on week days.
Initial download of the metrics may take a while.