Fig. 1
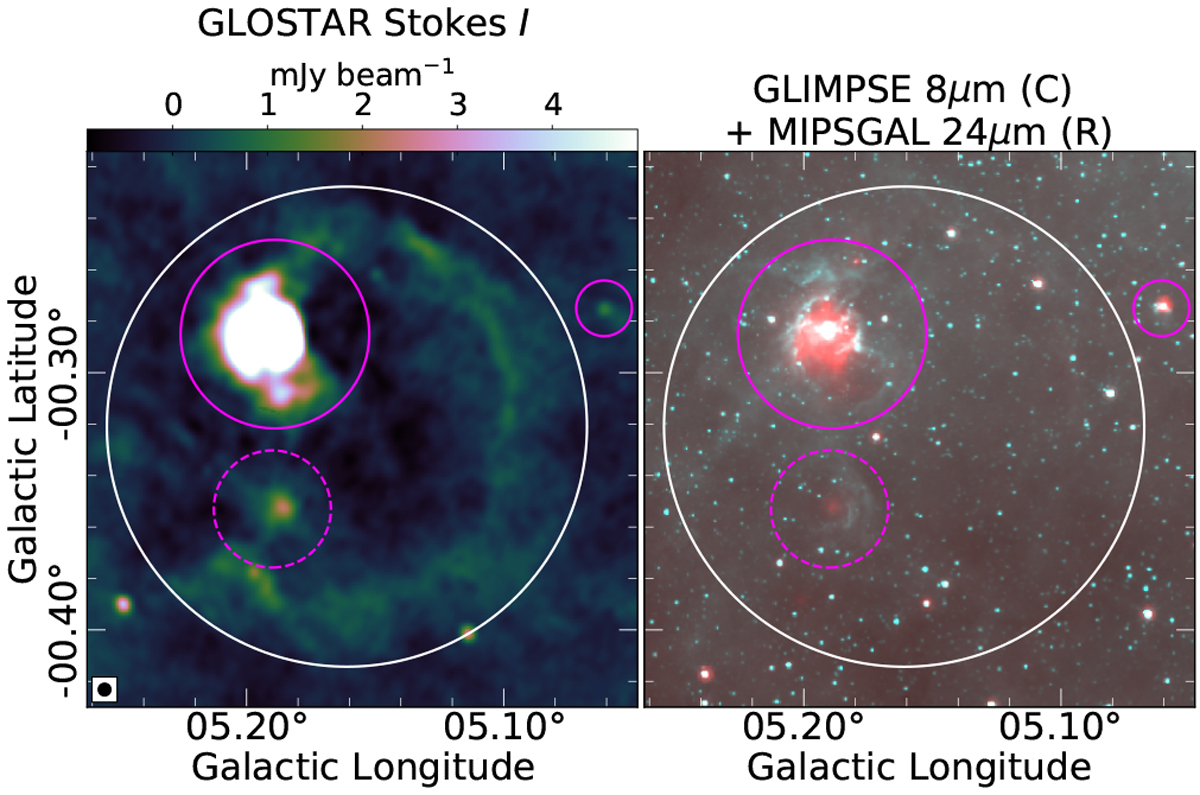
Example illustrating the criteria used to identify SNR candidates. The SNR candidate G005.161−0.321 (encircled in white) has a bright confirmed H II region G005.189−0.285 (large solid magenta circle) and a faint candidate H II region G005.189−0.354 (dashed magenta circle) within its angular extent. The data in the right panel are from MIPSGAL 24 μm (red) and GLIMPSE 8 μm (cyan). TheGLOSTAR-VLA image is presented in the left panel with the synthesized beam shown in black in the bottom left corner. This beam convention is followed throughout the paper. The object-marking scheme for all the figures in this paper is as follows: white circles mark newly identified SNR candidates, solid magenta circles mark confirmed H II regions, dashed magenta circles mark candidate H II regions, red circles mark G19 SNRs, and green circles mark previously identified SNR candidates described in Sect. 2.3.3.
Current usage metrics show cumulative count of Article Views (full-text article views including HTML views, PDF and ePub downloads, according to the available data) and Abstracts Views on Vision4Press platform.
Data correspond to usage on the plateform after 2015. The current usage metrics is available 48-96 hours after online publication and is updated daily on week days.
Initial download of the metrics may take a while.