Fig. 5.
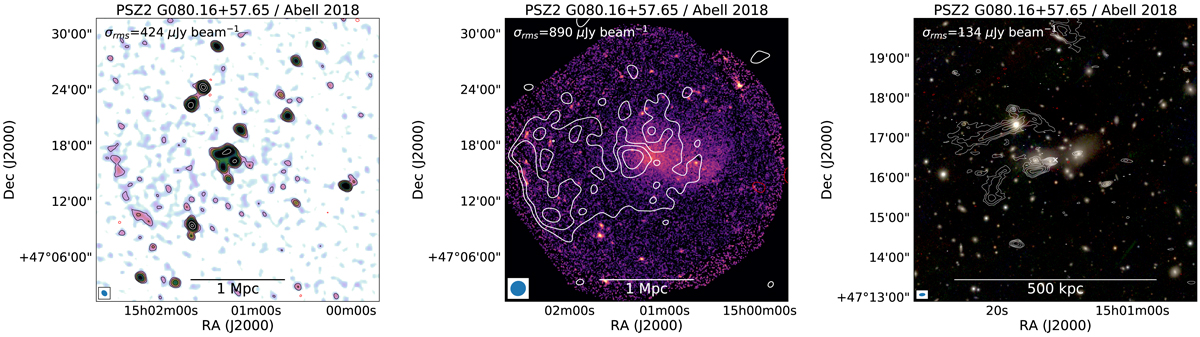
PSZ2 G080.16+57.65, Abell 2018. Left: low-resolution 144 MHz radio image made with a 30″ taper. Middle: XMM-Newton image with radio contours from a 90″ tapered image overlaid. Compact sources were subtracted in this image. Right: Pan-STARRS gri color image overlaid with radio contours from the robust −0.5 weighted image. The cluster center position is marked with a white “X”. Radio contours are drawn at 3σrms × [1, 2, 4, …], where σrms is the rms map noise. Negative −3σrms contours are drawn in red. The rms noise levels of the radio images used are provided in the top right corner of each panel.
Current usage metrics show cumulative count of Article Views (full-text article views including HTML views, PDF and ePub downloads, according to the available data) and Abstracts Views on Vision4Press platform.
Data correspond to usage on the plateform after 2015. The current usage metrics is available 48-96 hours after online publication and is updated daily on week days.
Initial download of the metrics may take a while.