Fig. 3.
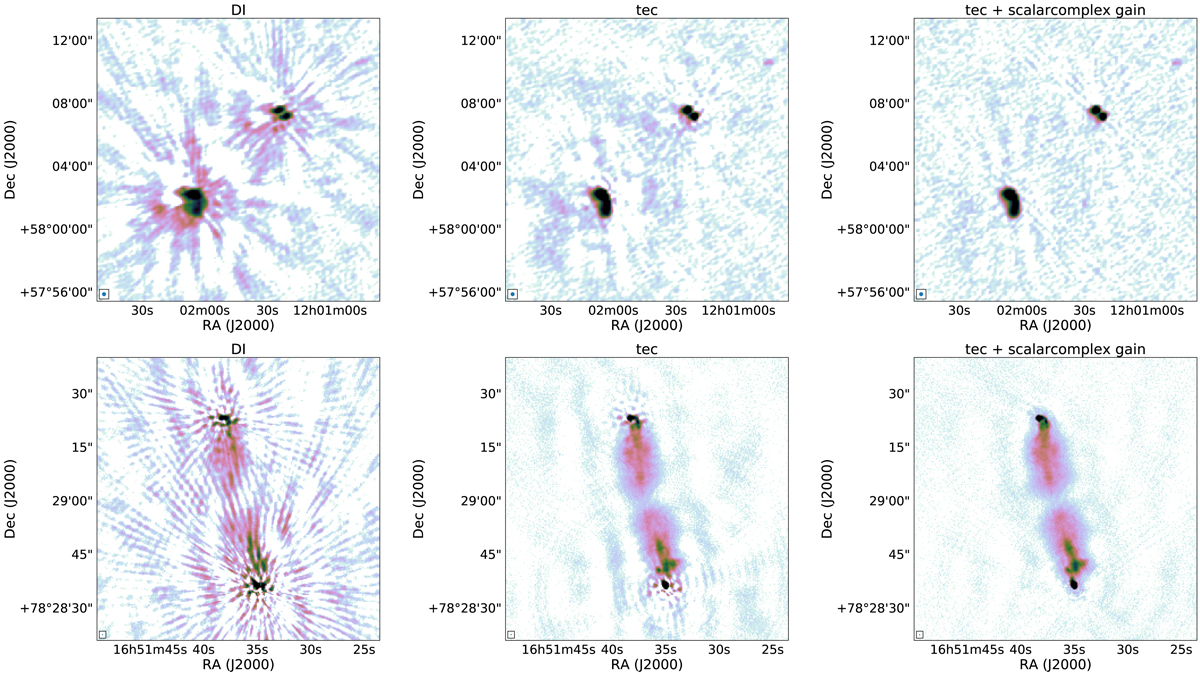
Improvement during self-calibration on extracted data. Left column: starting point of this process: a DI calibrated image. Middle column: results after DPPP TEC calibration, with all LOFAR core stations forced (“antenna constraint” solve) to have the same solution. Right column: final image after DPPP scalarcomplex gain calibration. Top row: 43–67 MHz LBA data. Bottom row: LOFAR international-baseline 120–168 MHz HBA data.
Current usage metrics show cumulative count of Article Views (full-text article views including HTML views, PDF and ePub downloads, according to the available data) and Abstracts Views on Vision4Press platform.
Data correspond to usage on the plateform after 2015. The current usage metrics is available 48-96 hours after online publication and is updated daily on week days.
Initial download of the metrics may take a while.