Fig. 25.
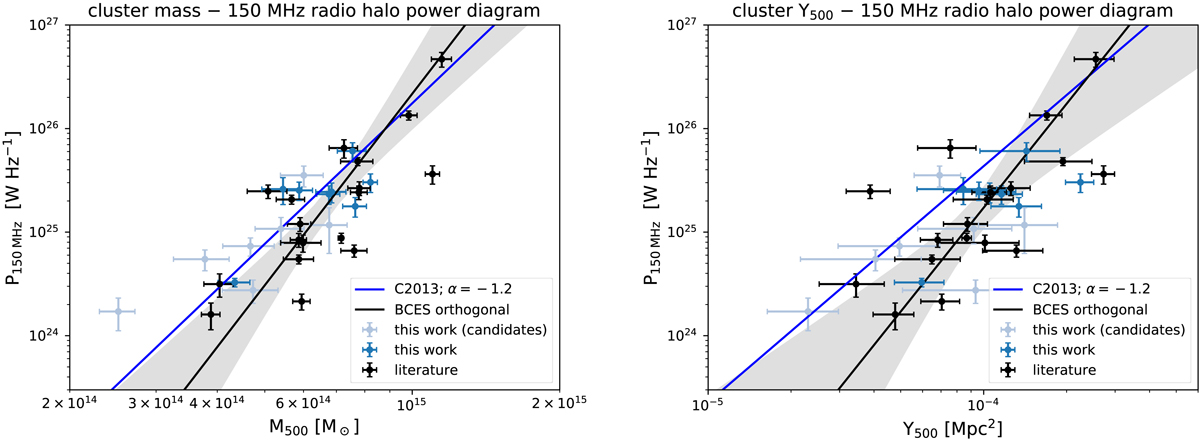
Radio halo powers plotted against cluster mass proxies. Left: distribution of clusters in the mass (M500) 150 MHz radio power (P150 MHz) plane. The solid black line displays the BCES orthogonal fit (candidate halos were excluded). The shaded region shows the 3σ (99.7% confidence) region of the fit. The blue line is the BCES orthogonal fit from Cassano et al. (2013) scaled with a spectral index of −1.2. Right: distribution of clusters in the Y500 150 MHz radio power plane. The plotted symbols and lines represent the same data sets as in the left panel.
Current usage metrics show cumulative count of Article Views (full-text article views including HTML views, PDF and ePub downloads, according to the available data) and Abstracts Views on Vision4Press platform.
Data correspond to usage on the plateform after 2015. The current usage metrics is available 48-96 hours after online publication and is updated daily on week days.
Initial download of the metrics may take a while.