Fig. 7
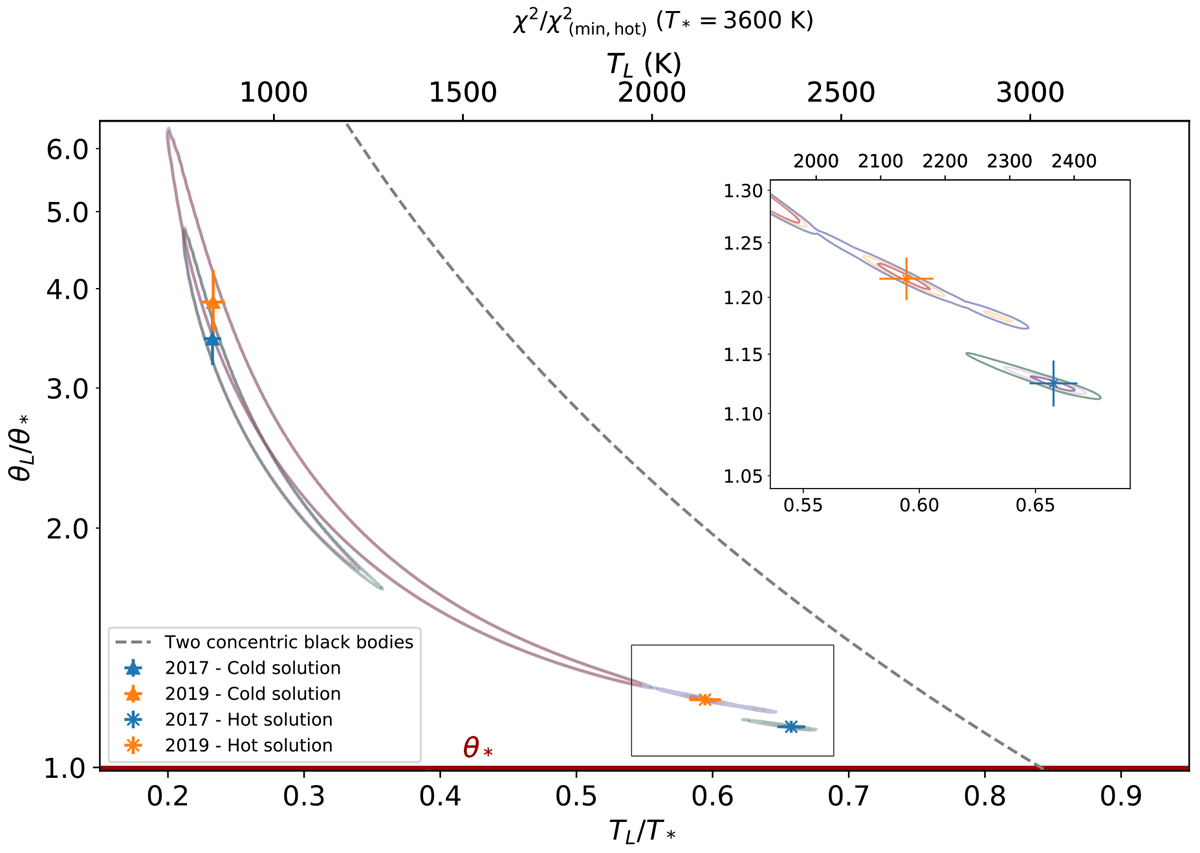
Contour plot of the χ2 maps (Eq. (8)) considering TL, θL, which are the two parameters of interest. Solid lines: decrease of likelihood of 1, 3, and 5 σ relative to the hot solution minimum of each epoch (Press et al. 1992). Grey dashed line: temperature profile of a spherically thin shell enclosing a perfect black body (Eq. (9)). Triangles with error bars: cold solutions for both epochs corresponding to the absolute minima. Crosses with error bars: hot solutions for both epochs (corresponding to the local minima).
Current usage metrics show cumulative count of Article Views (full-text article views including HTML views, PDF and ePub downloads, according to the available data) and Abstracts Views on Vision4Press platform.
Data correspond to usage on the plateform after 2015. The current usage metrics is available 48-96 hours after online publication and is updated daily on week days.
Initial download of the metrics may take a while.