Fig. 5.
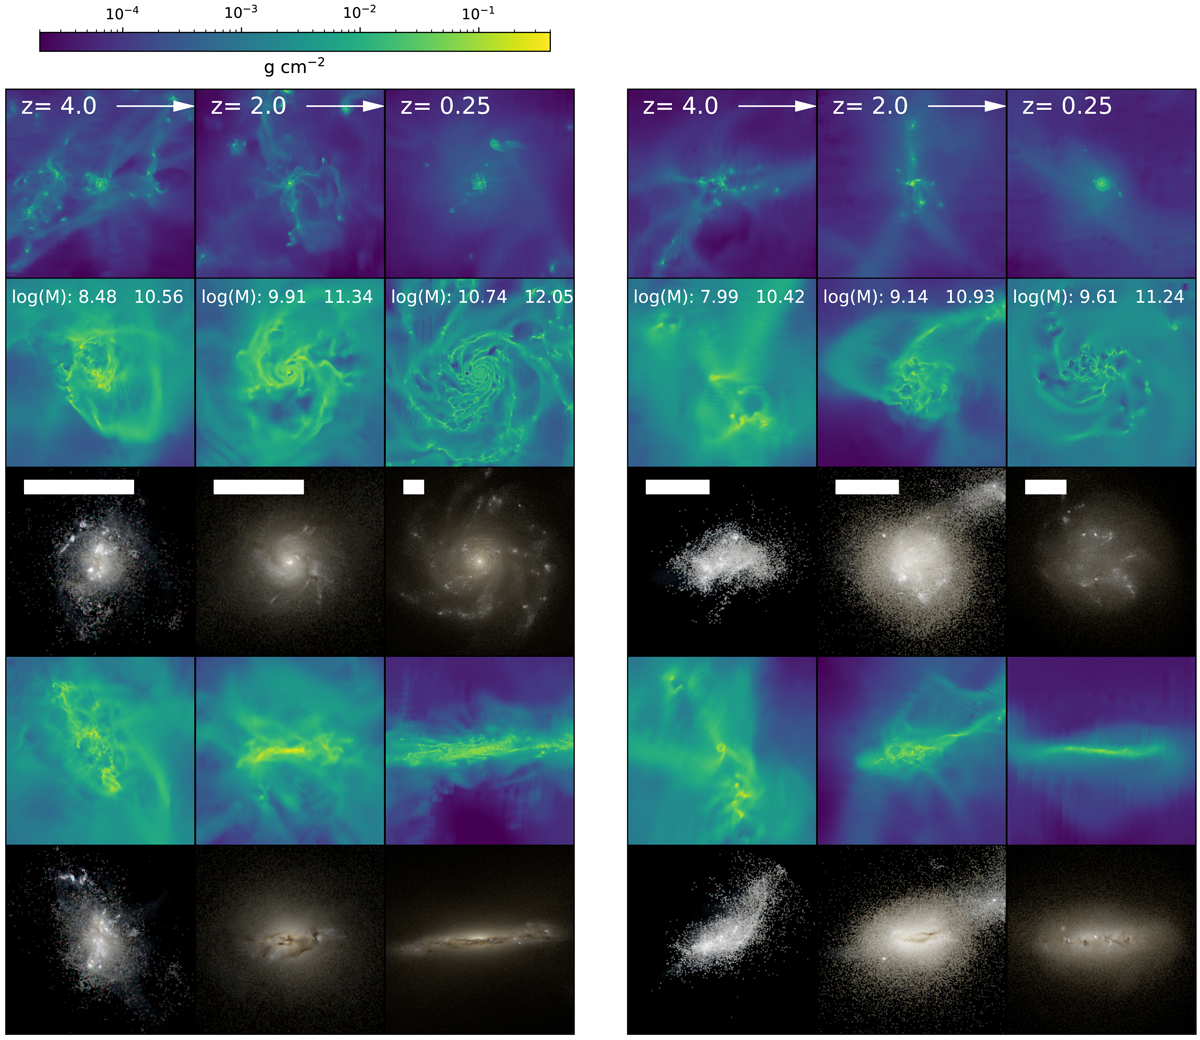
Projection of the gas density and mock observations. Panels on the left are images of a massive galaxy at different epochs and the panels on the right are for a less massive galaxy. First row: gas density projections a of 1.4 Mpc at different epochs, while the second and fourth rows are zoomed-in gas density projections with face-on and edge-on views of the galaxy, respectively. Third and fifth rows are SKIRT mock observations in face-on and edge-on direction. Stellar mass and halo mass of each galaxy at each epoch are given in the second row in log scale. For a galaxy at a given epoch, the second to fifth panels are on the same scale and the white bar in third row indicates 5 kpc. Gas density maps share the same colour scheme as given in the colour bar.
Current usage metrics show cumulative count of Article Views (full-text article views including HTML views, PDF and ePub downloads, according to the available data) and Abstracts Views on Vision4Press platform.
Data correspond to usage on the plateform after 2015. The current usage metrics is available 48-96 hours after online publication and is updated daily on week days.
Initial download of the metrics may take a while.