Fig. 14.
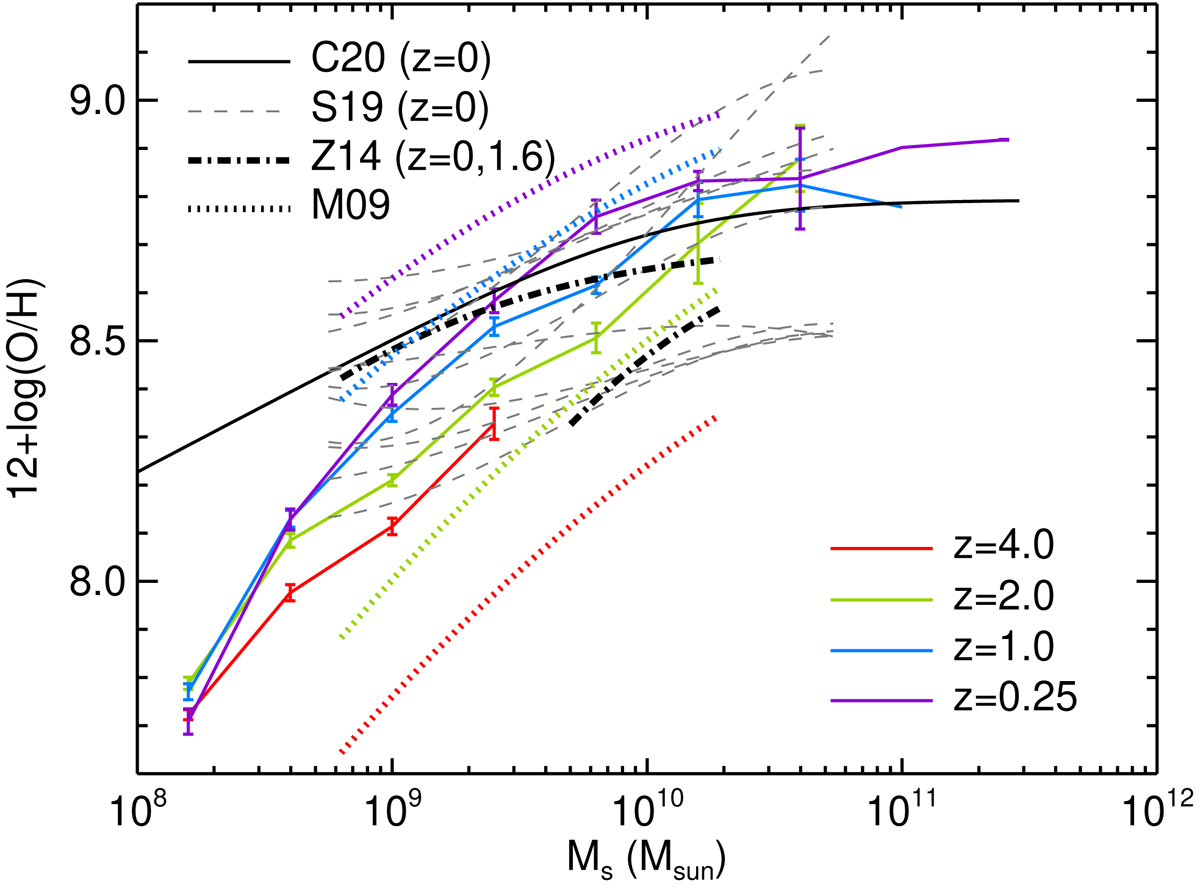
Average abundance of oxygen (coloured solid) in the cold gas as a function of stellar mass for different redshifts in NEWHORIZON as indicated in the panel. The error bars stand for the error around the mean. Several observational relations are also shown from Mannucci et al. (2009; M09; in dotted lines with four different colours corresponding to z = 0.07, 0.7, 2.2, and 3.5), Zahid et al. (2014; Z14; dot-dashed line), Sánchez et al. (2019; S19; dashed lines with different lines corresponding to various oxygen calibrators), and Curti et al. (2020; C20; black solid).
Current usage metrics show cumulative count of Article Views (full-text article views including HTML views, PDF and ePub downloads, according to the available data) and Abstracts Views on Vision4Press platform.
Data correspond to usage on the plateform after 2015. The current usage metrics is available 48-96 hours after online publication and is updated daily on week days.
Initial download of the metrics may take a while.