Fig. 12.
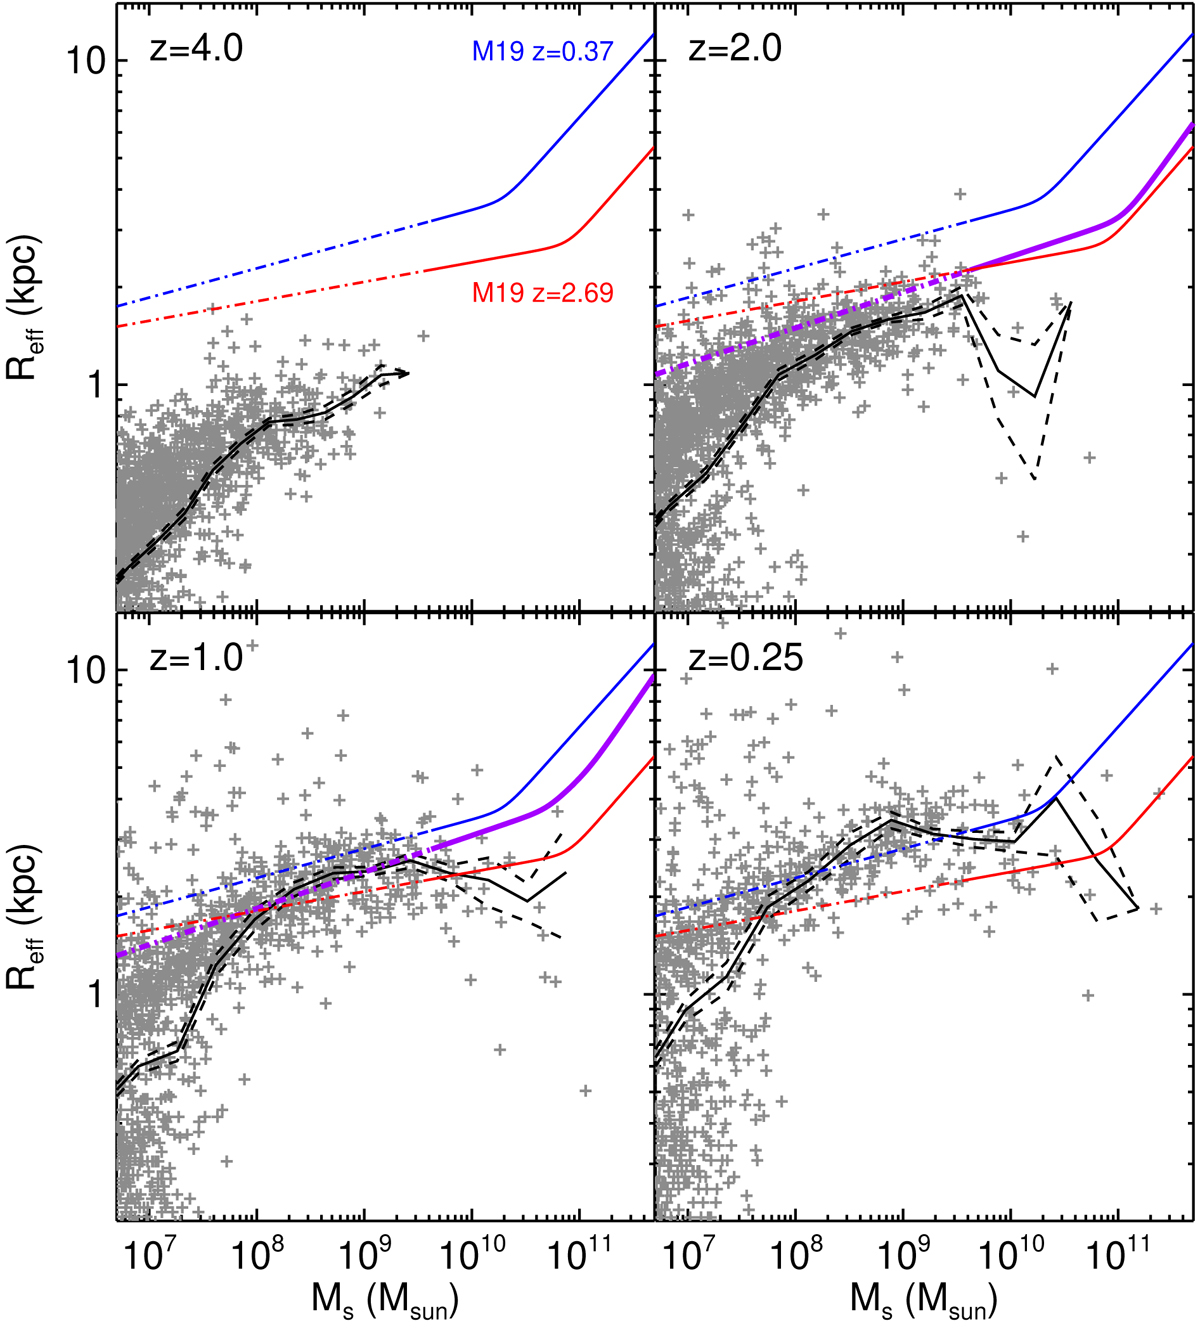
Effective radius as a function of stellar mass in NEWHORIZON at different redshifts for individual galaxies (grey crosses) and for the average (solid line) with standard deviation (dashed lines). The sizes are computed with the geometric mean of the x, y, z effective radius using the AdaptaHOP classification. Observations from Mowla et al. (2019) are shown as a purple line at the current redshift when available and with their most extreme redshift fits at z = 0.37 and z = 2.69 in blue and red, respectively, which are extrapolated (triple dot-dashed line) beyond their range of available data (solid line) to guide the eye. Galaxies in NEWHORIZON are more compact at high redshift as opposed to low redshift in good agreement with observations.
Current usage metrics show cumulative count of Article Views (full-text article views including HTML views, PDF and ePub downloads, according to the available data) and Abstracts Views on Vision4Press platform.
Data correspond to usage on the plateform after 2015. The current usage metrics is available 48-96 hours after online publication and is updated daily on week days.
Initial download of the metrics may take a while.