Fig. 10.
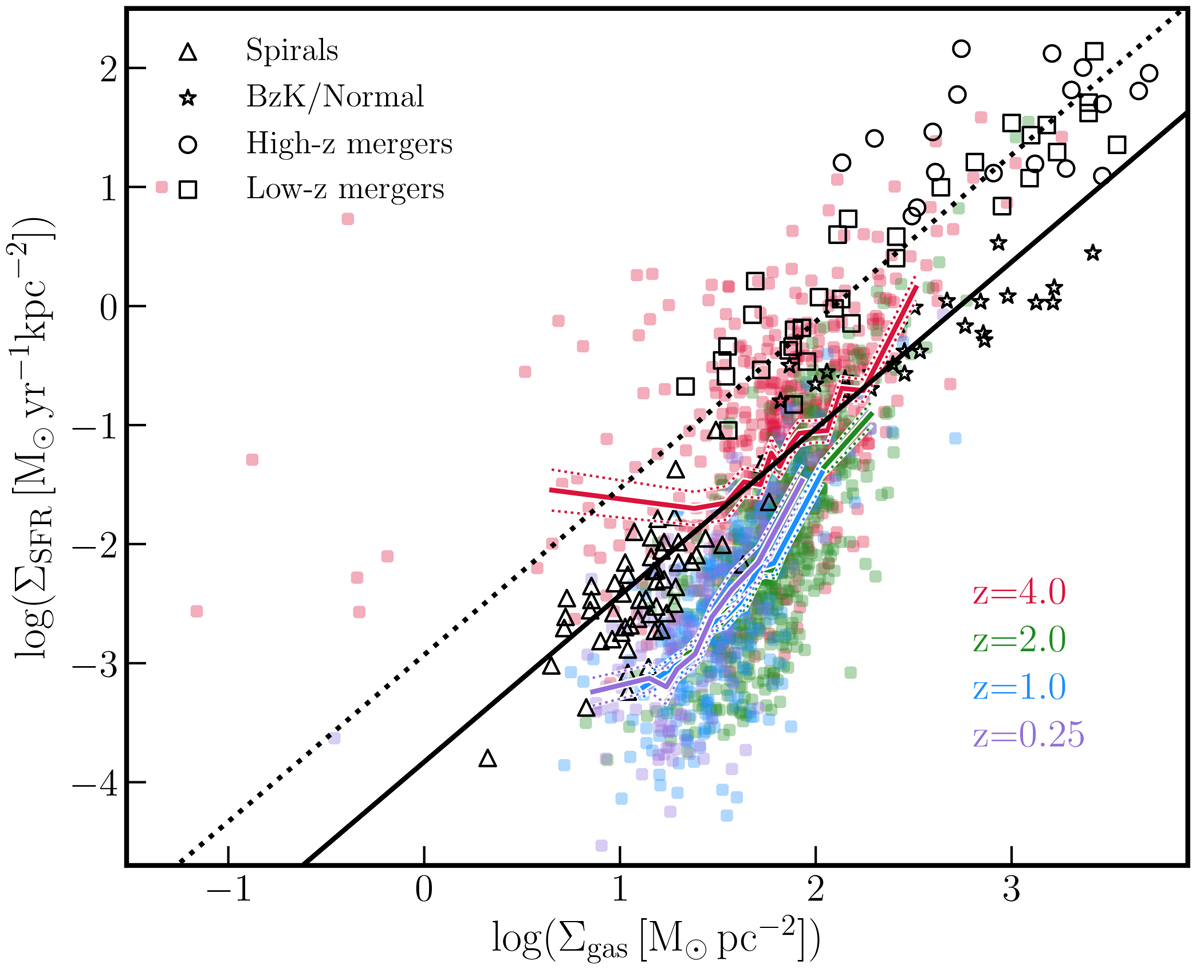
Kennicutt–Schmidt relation compared to observations. Filled coloured circles correspond to NEWHORIZON galaxies at various redshifts. The mean and error on the mean are shown with solid and dotted coloured lines, respectively. The empty black symbols correspond to observational datasets: triangles are local spirals (Kennicutt 1998), stars are high-z BzK/Normal galaxies (Daddi et al. 2010a; Tacconi et al. 2010), circles high-z mergers (Bouché et al. 2007; Bothwell et al. 2009), and squares low-z mergers (Kennicutt 1998). The solid black and dotted black lines represent the sequence of discs and starbursts, respectively, from Daddi et al. (2010b). The NEWHORIZON tool is able to capture the galaxy main sequence, although the SFR surface densities are slightly lower than in the observational data. There is a larger fraction of high SFR galaxies at higher redshift in qualitative agreement with observations.
Current usage metrics show cumulative count of Article Views (full-text article views including HTML views, PDF and ePub downloads, according to the available data) and Abstracts Views on Vision4Press platform.
Data correspond to usage on the plateform after 2015. The current usage metrics is available 48-96 hours after online publication and is updated daily on week days.
Initial download of the metrics may take a while.