Fig. 9
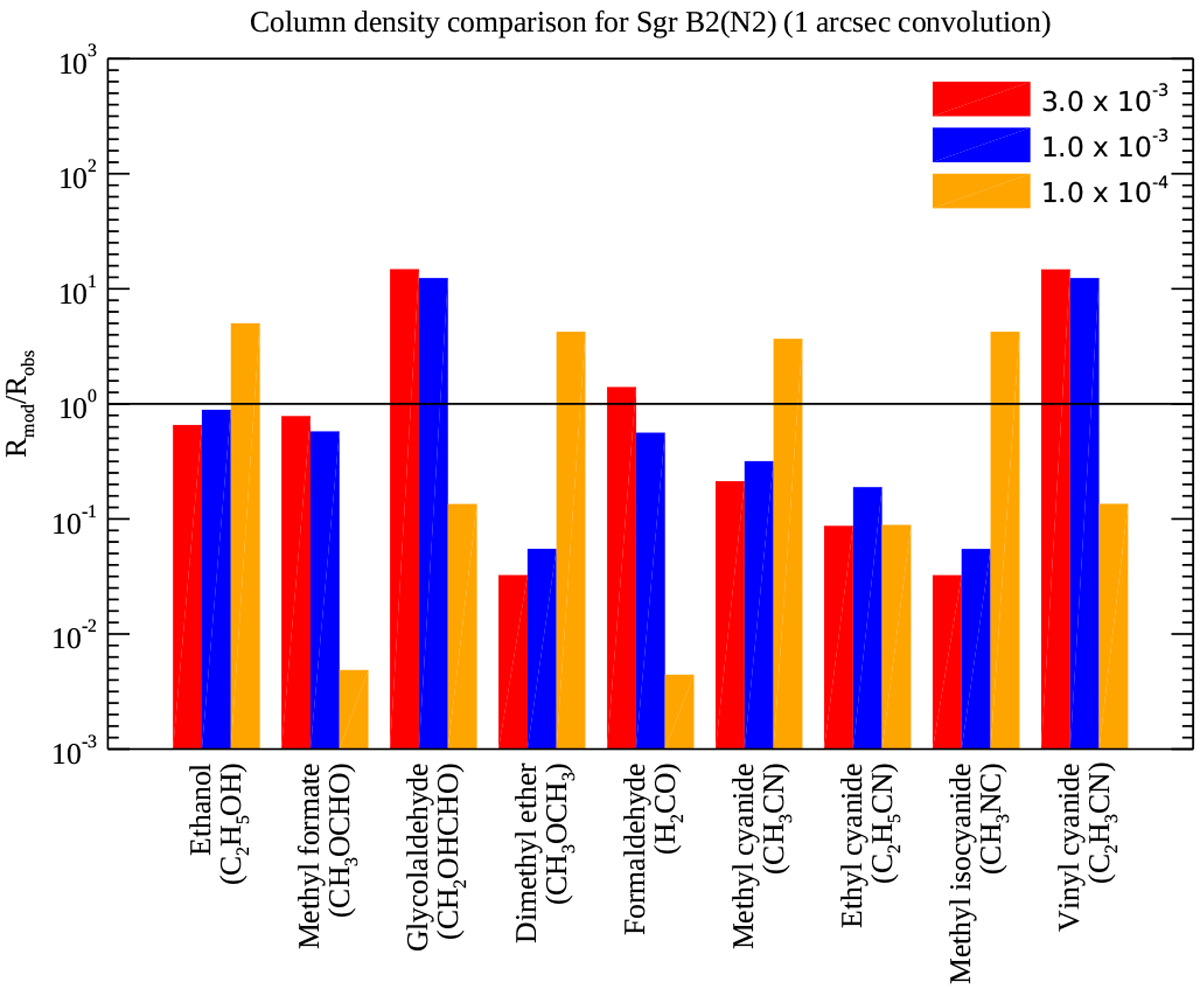
Comparison among observed column densities for select COMs toward Sgr B2(N2) and those modeled on-source using a 1 arcsec beam convolution. The red bars illustrate column densities for the 3.0 × 10⁻³ M⊙ yr−1 model, the blue bars illustrate column densities for the 1.0 × 10⁻³ M⊙ yr−1 model, and the orange bars illustrate column densities for the 1.0 × 10⁻⁴ M⊙ yr−1 model. Rmod represents modeled column density ratios relative to methanol, and Robs represents observed column density ratios relative to methanol (Jørgensen et al. 2020). The horizontal line indicates a value of 1 on the y-axis.
Current usage metrics show cumulative count of Article Views (full-text article views including HTML views, PDF and ePub downloads, according to the available data) and Abstracts Views on Vision4Press platform.
Data correspond to usage on the plateform after 2015. The current usage metrics is available 48-96 hours after online publication and is updated daily on week days.
Initial download of the metrics may take a while.