Fig. 7
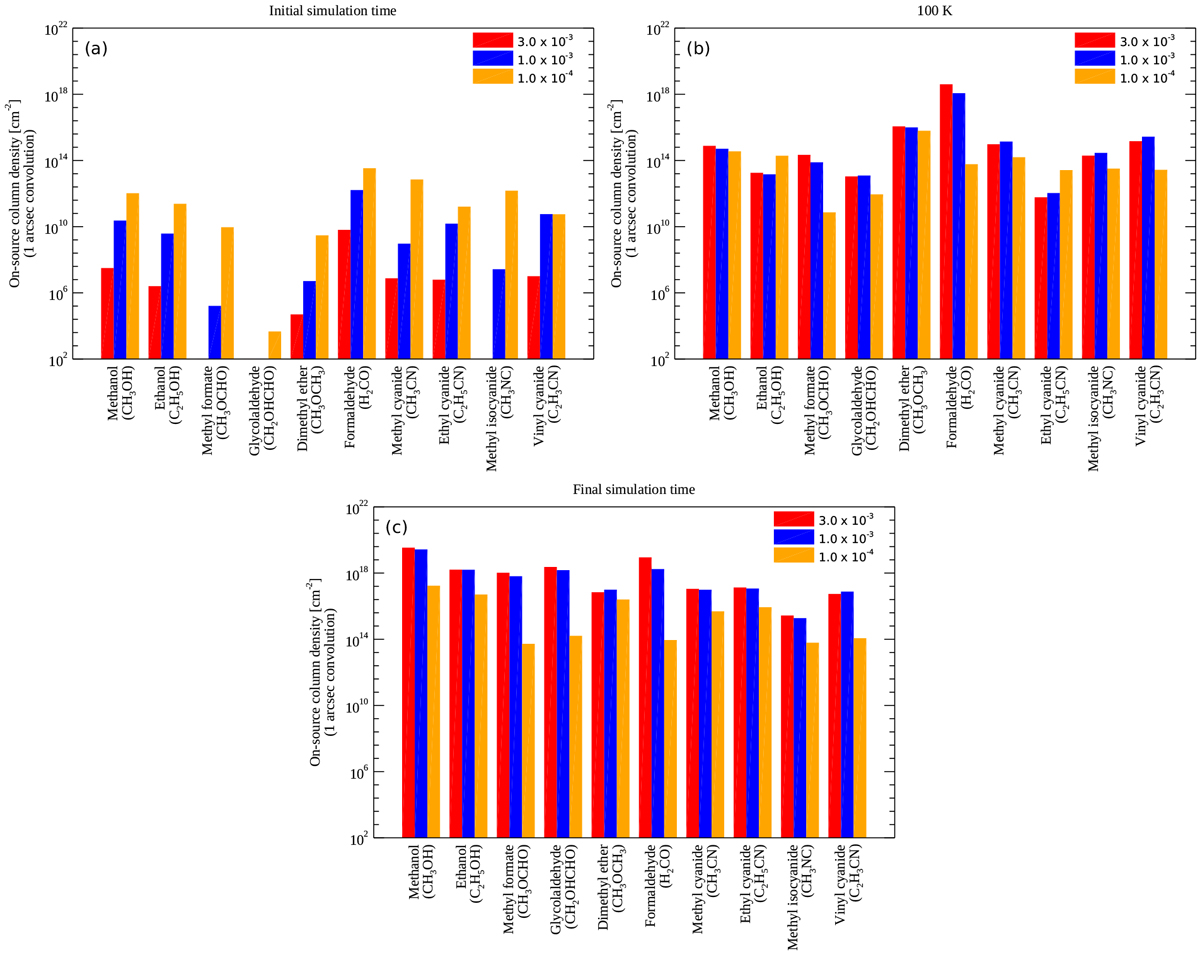
On-source column densities for select COMs using a 1 arcsec beam convolution. The red bars illustrate column densities for the 3.0 × 10⁻³ M⊙ yr−1 model, the blue bars illustrate column densities for the 1.0 × 10⁻³ M⊙ yr−1 model, and the orange bars illustrate column densities for the 1.0 × 10⁻⁴ M⊙ yr−1 model. Panel a shows column densities for the initial stage-2 simulation time, panel b shows column densities for stage-2 simulation times that correspond to a temperature of 100 K, and panel c shows column densities for the final stage-2 simulation time. It should be noted that the ranges for the vertical axis differ for all panels.
Current usage metrics show cumulative count of Article Views (full-text article views including HTML views, PDF and ePub downloads, according to the available data) and Abstracts Views on Vision4Press platform.
Data correspond to usage on the plateform after 2015. The current usage metrics is available 48-96 hours after online publication and is updated daily on week days.
Initial download of the metrics may take a while.