Fig. 6
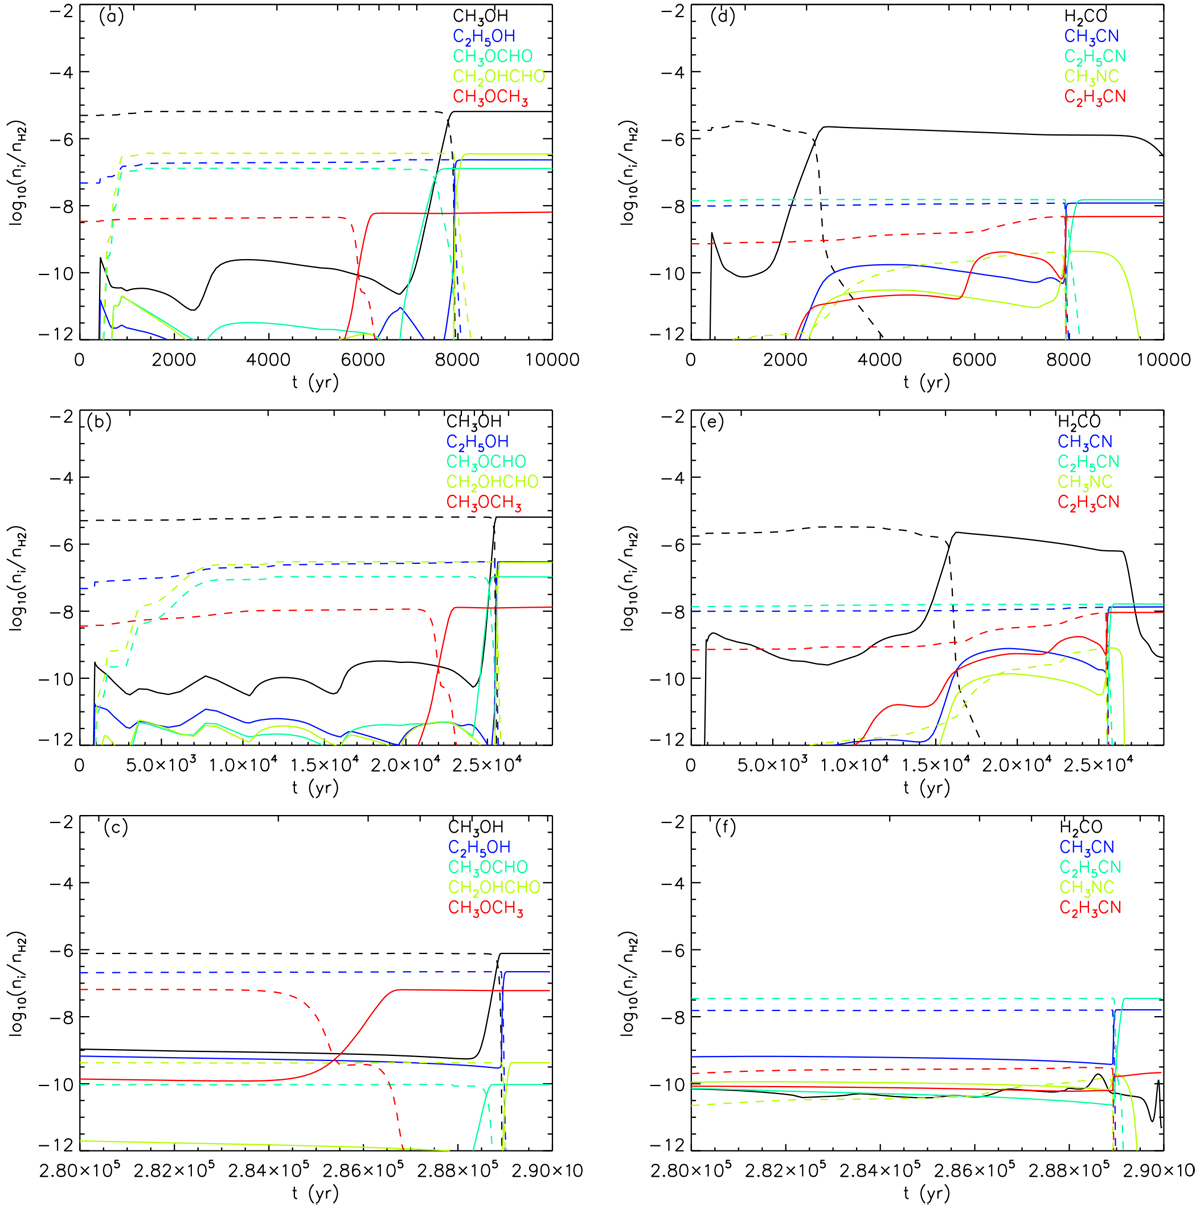
Time-dependent fractional abundance plots (with respect to H2) for select COMs, for the innermost trajectory in each accretion-rate model. Panels a through c show all-time innermost trajectory fractional abundances for methanol (black), ethanol (blue), methyl formate (green), glycolaldehyde (yellow), and dimethyl ether (red). Panels d through f show all-time innermost trajectory fractional abundances for formaldehyde (black), methyl cyanide (blue), ethyl cyanide (green), methyl isocyanide (yellow), and vinyl cyanide (red). Upper panels a and d correspond to the 3.0 × 10⁻³ M⊙ yr−1 mass-accretion rate, middle panels b and e correspond to the 1.0 × 10⁻³ M⊙ yr−1 mass-accretion rate, and lower panels c and f correspond to the 1.0 × 10⁻⁴ M⊙ yr−1 mass-accretion rate. Solid lines correspond to gas-phase abundances, whereas dashed lines correspond to surface/ice-mantle abundances. It should be noted that the range for the horizontal axis is different for models of different mass-accretion rates.
Current usage metrics show cumulative count of Article Views (full-text article views including HTML views, PDF and ePub downloads, according to the available data) and Abstracts Views on Vision4Press platform.
Data correspond to usage on the plateform after 2015. The current usage metrics is available 48-96 hours after online publication and is updated daily on week days.
Initial download of the metrics may take a while.