Fig. 3
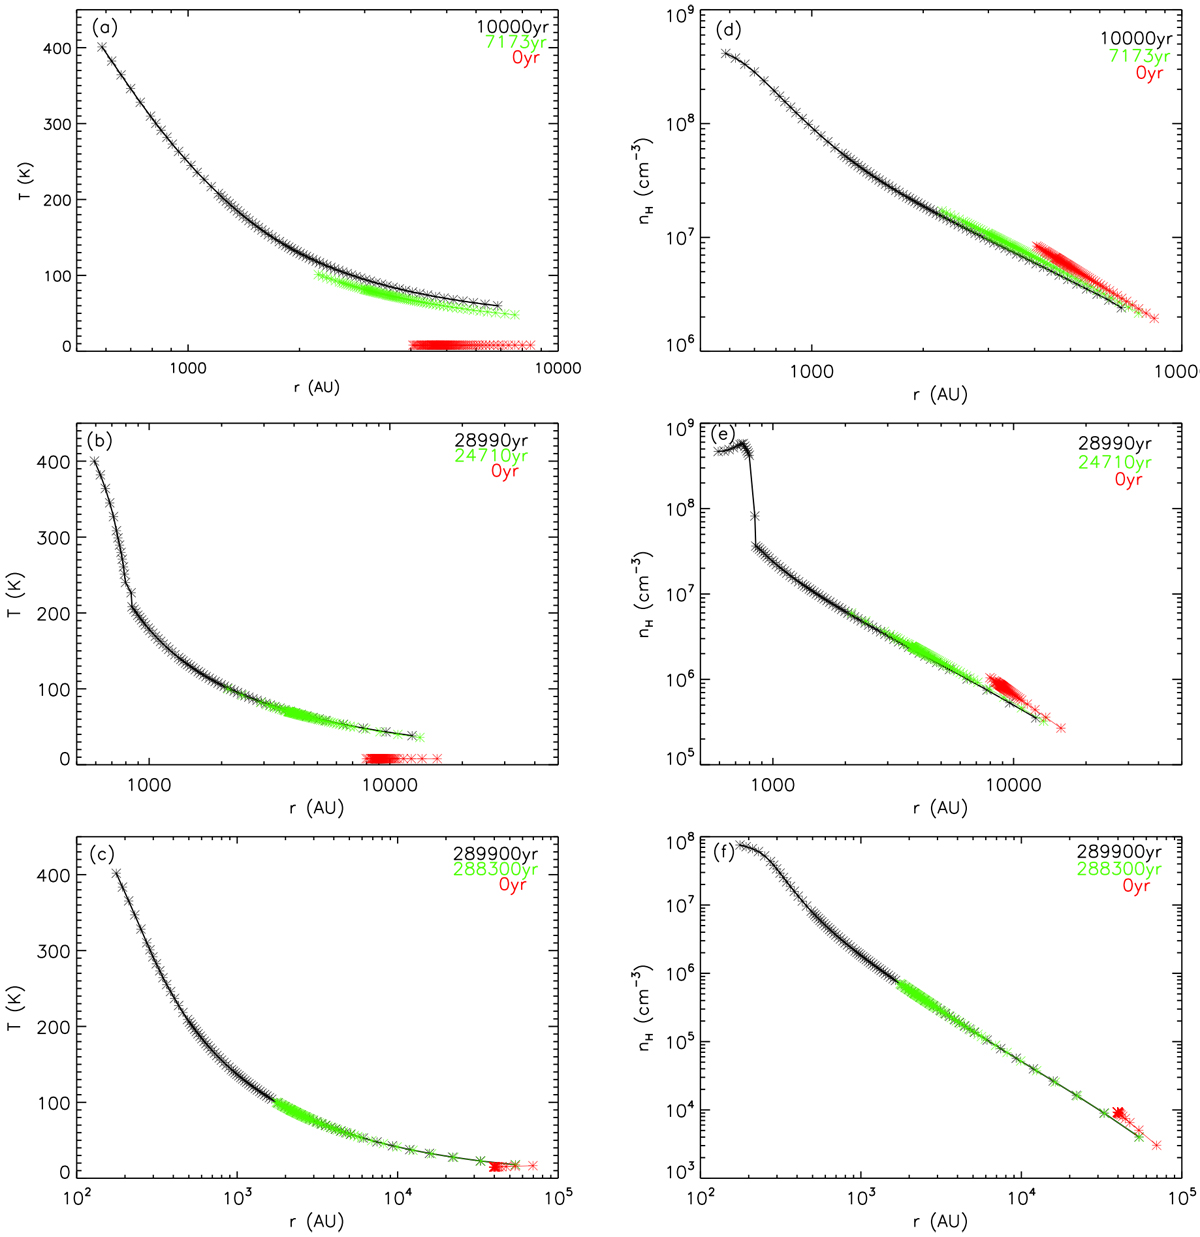
Radius-dependent physical profiles of the three mass-accretion rates used in the chemical models. Panels a to c show temperature profiles as a function of radius, whereas panels d to f show density profiles as a function of radius. Upper panels a and d correspond to the 3.0 × 10⁻³ M⊙ yr−1 mass-accretion rate, middle panels b and e correspond to the 1.0 × 10⁻³ M⊙ yr−1 mass-accretion rate, and the lower panels c and f correspond to the 1.0 × 10⁻⁴ M⊙ yr−1 mass-accretion rate. The black curves represent the final stage-2 simulation time, the green curves represent a stage-2 simulation time corresponding to 100 K for the innermost trajectory of each mass-accretion rate, and the red curves represent the initial stage-2 simulation time. It should be noted that the range for the horizontal axis is different for models of different mass-accretion rates.
Current usage metrics show cumulative count of Article Views (full-text article views including HTML views, PDF and ePub downloads, according to the available data) and Abstracts Views on Vision4Press platform.
Data correspond to usage on the plateform after 2015. The current usage metrics is available 48-96 hours after online publication and is updated daily on week days.
Initial download of the metrics may take a while.