Fig. 6
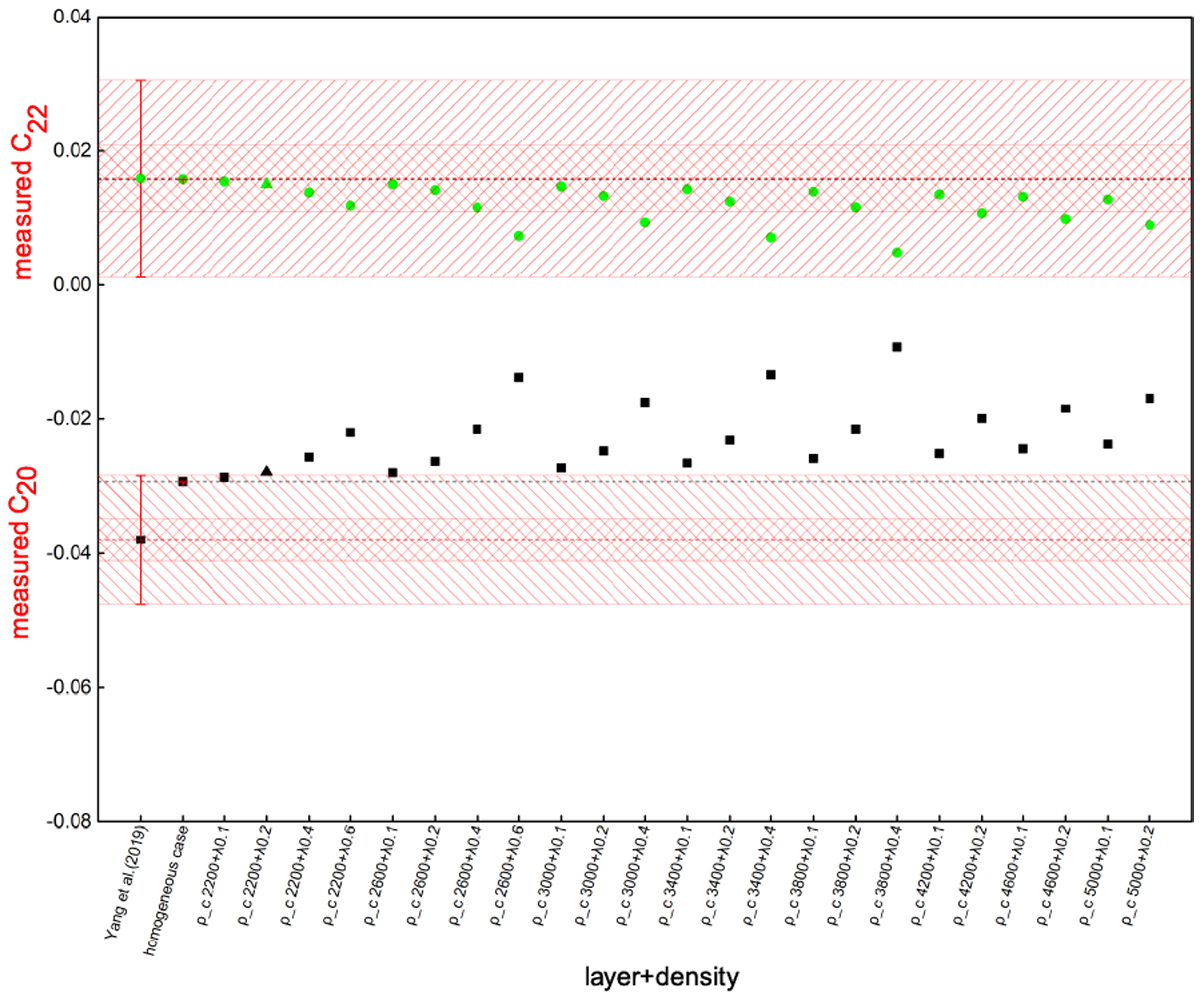
Modeled normalized spherical harmonic coefficients C20 (black dots) and C22 (green dots) vs. the measured values from Yang et al. (2019), as in Fig. 5, but for the scenarios where the core is denser than the mantle (the core shape is homothetic to the Phobos surface). Triangles represent the layering cases that agree well with the C20 from Yang et al. (2019). The 1σ and 3σ error bars for the measured coefficients are shaded and crossed bands. Most of the modeled C20 values are outside the 3σ band around the measured value, excluding these scenarios. The case marked by a triangle is shown in Table 4.
Current usage metrics show cumulative count of Article Views (full-text article views including HTML views, PDF and ePub downloads, according to the available data) and Abstracts Views on Vision4Press platform.
Data correspond to usage on the plateform after 2015. The current usage metrics is available 48-96 hours after online publication and is updated daily on week days.
Initial download of the metrics may take a while.