Fig. 5
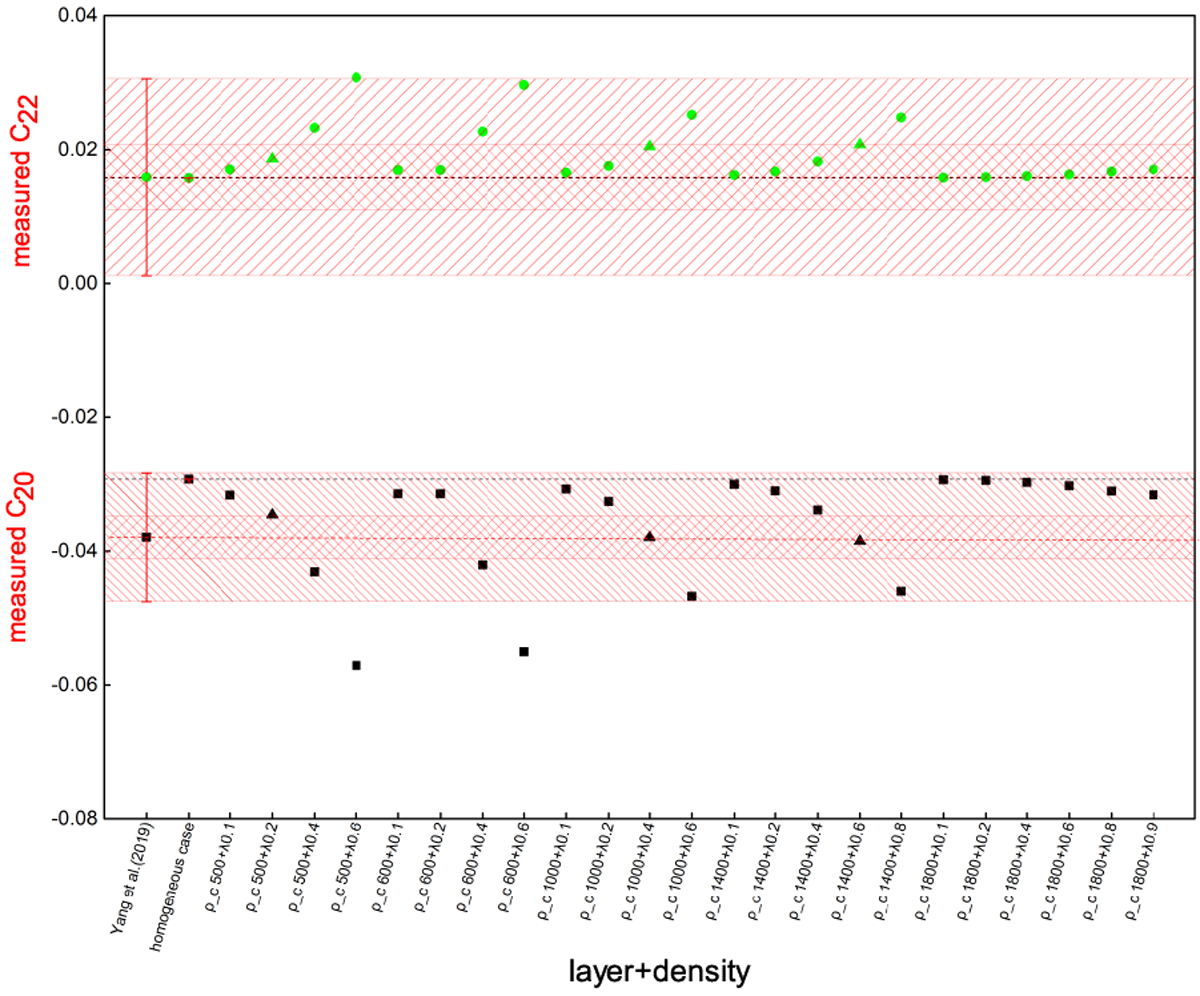
Modeled normalized spherical harmonic coefficients C20 (black dots) and C22 (green dots) vs. the measured values by Yang et al. (2019) for the scenario where the mantle is denser than the core (the core shape is homothetic to the Phobos surface).The 1σ and 3σ error bars for the measured coefficients are the shaded and crossed bands. The different cases are shown along the y-axis: ρ_ c represents the density of the core, and ![]() represents the scaling size factor of the core. The scaling parameter λ varies from λ = 0 (no core) to λ = 1 (core boundary confounded with the surface). The dotted black line denotes the C20 and C22 values of the homogeneous case. The associated error bars are too small to be plotted two-layer modeled coefficients). The dotted red line denotes the measured C20 and C22 values with their associated 3σ formal errors (shaded red bands) and their associated 1σ formal errors (cross-hatched red bands). Triangle represent the layering cases that agree well with the C20 from Yang et al. (2019). The normalized harmonic coefficients are computed with respect to a reference radius of 14 km. The cases marked by triangles are shown in Table 3.
represents the scaling size factor of the core. The scaling parameter λ varies from λ = 0 (no core) to λ = 1 (core boundary confounded with the surface). The dotted black line denotes the C20 and C22 values of the homogeneous case. The associated error bars are too small to be plotted two-layer modeled coefficients). The dotted red line denotes the measured C20 and C22 values with their associated 3σ formal errors (shaded red bands) and their associated 1σ formal errors (cross-hatched red bands). Triangle represent the layering cases that agree well with the C20 from Yang et al. (2019). The normalized harmonic coefficients are computed with respect to a reference radius of 14 km. The cases marked by triangles are shown in Table 3.
Current usage metrics show cumulative count of Article Views (full-text article views including HTML views, PDF and ePub downloads, according to the available data) and Abstracts Views on Vision4Press platform.
Data correspond to usage on the plateform after 2015. The current usage metrics is available 48-96 hours after online publication and is updated daily on week days.
Initial download of the metrics may take a while.