Fig. 1
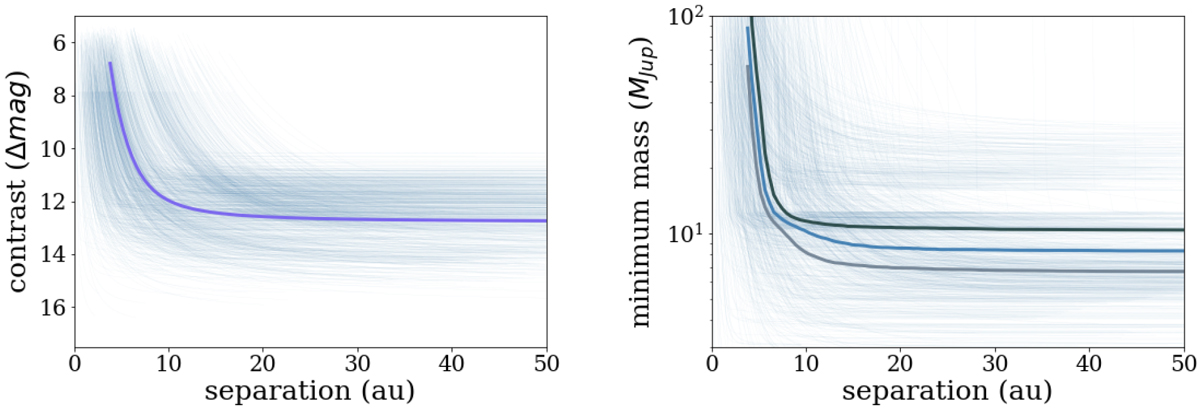
Expected IFS detection limits (light blue curves), evaluated using the method described in Mesa et al. (2015), expressed interms of contrast (left panel) or minimum companion mass (right panel, calculated assuming the best age for each target). The solid blue line shows the average over the full input sample. The light and dark gray curves in the right panel show the average mass limit obtained adopting the minimum and maximum values of the age, respectively.
Current usage metrics show cumulative count of Article Views (full-text article views including HTML views, PDF and ePub downloads, according to the available data) and Abstracts Views on Vision4Press platform.
Data correspond to usage on the plateform after 2015. The current usage metrics is available 48-96 hours after online publication and is updated daily on week days.
Initial download of the metrics may take a while.