Fig. 7.
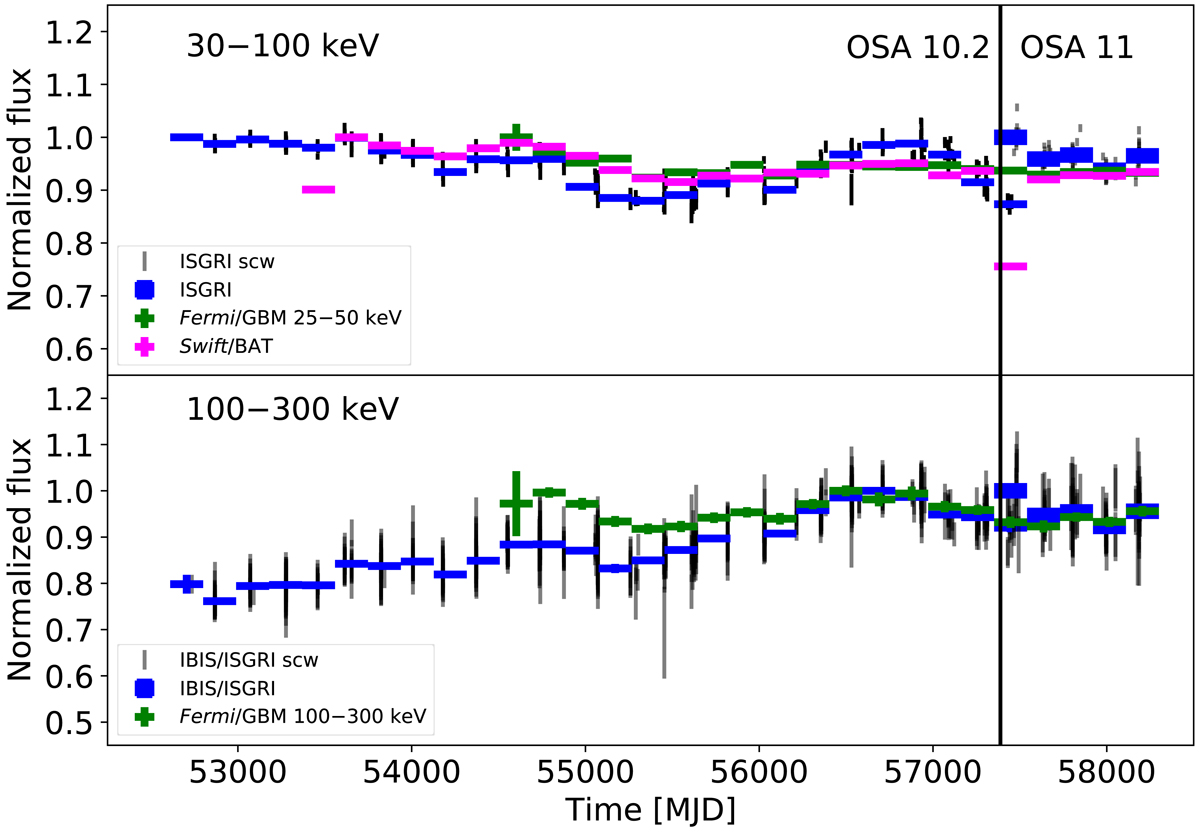
Evolution of the Crab count rate over 17 years of INTEGRAL operations in 30–100 keV (top panel) and 100–300 keV (bottom panel) energy ranges compared to those observed by Swift/BAT (magenta) and Fermi/GBM (green data points; Wilson-Hodge et al. 2011). Grey data points show the light curve binned in ScW by ScW time bins by the ODA. Blue data points show the rebinned individual ScW measurements. The Jupyter notebook Crab_lc_longterm.ipynb can be launched used to generate these long-term light curves via API access to ODA.
Current usage metrics show cumulative count of Article Views (full-text article views including HTML views, PDF and ePub downloads, according to the available data) and Abstracts Views on Vision4Press platform.
Data correspond to usage on the plateform after 2015. The current usage metrics is available 48-96 hours after online publication and is updated daily on week days.
Initial download of the metrics may take a while.