Fig. 16.
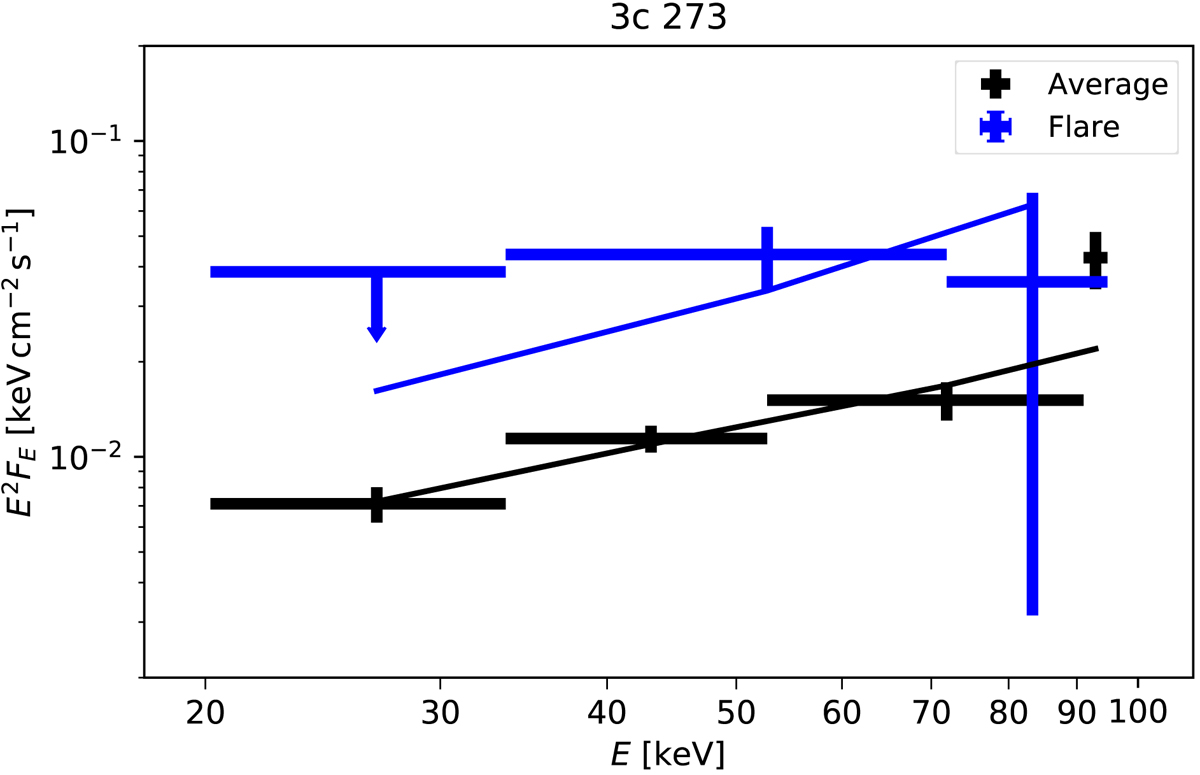
Comparison of the time-averaged spectrum of 3C 279 (black) with the spectrum of the flaring state observed during the TOO period reported by Bottacini et al. (2016) in blue; the upper limit is at the 3σ confidence level. The respective models are represented as solid lines. The notebook 3C279_spectrum.ipynb to calculate the spectra can be launched using this URL.
Current usage metrics show cumulative count of Article Views (full-text article views including HTML views, PDF and ePub downloads, according to the available data) and Abstracts Views on Vision4Press platform.
Data correspond to usage on the plateform after 2015. The current usage metrics is available 48-96 hours after online publication and is updated daily on week days.
Initial download of the metrics may take a while.