Fig. 15.
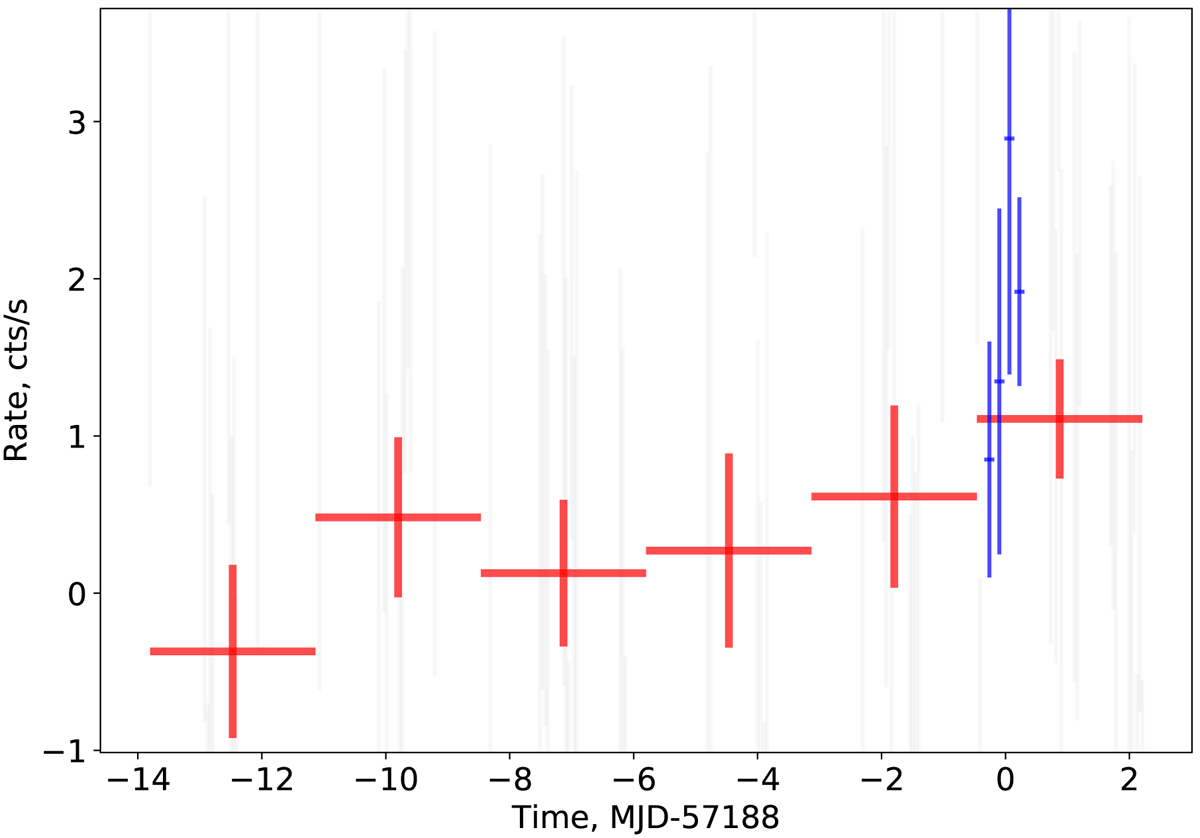
Light curve of 3C 279 in 20–100 keV range for the flare period reported by Bottacini et al. (2016; red points), extracted using the ODA API, and the ISGRI light curve reported in Fig. 1 of Bottacini et al. (2016; blue points), corresponding to their ISGRI data time span. The notebook 3C279_lc_flare.ipynb to regenerate the result can be executed online at this URL, and can be re-executed via Binder integration of the oda-hub project.
Current usage metrics show cumulative count of Article Views (full-text article views including HTML views, PDF and ePub downloads, according to the available data) and Abstracts Views on Vision4Press platform.
Data correspond to usage on the plateform after 2015. The current usage metrics is available 48-96 hours after online publication and is updated daily on week days.
Initial download of the metrics may take a while.