Fig. 13.
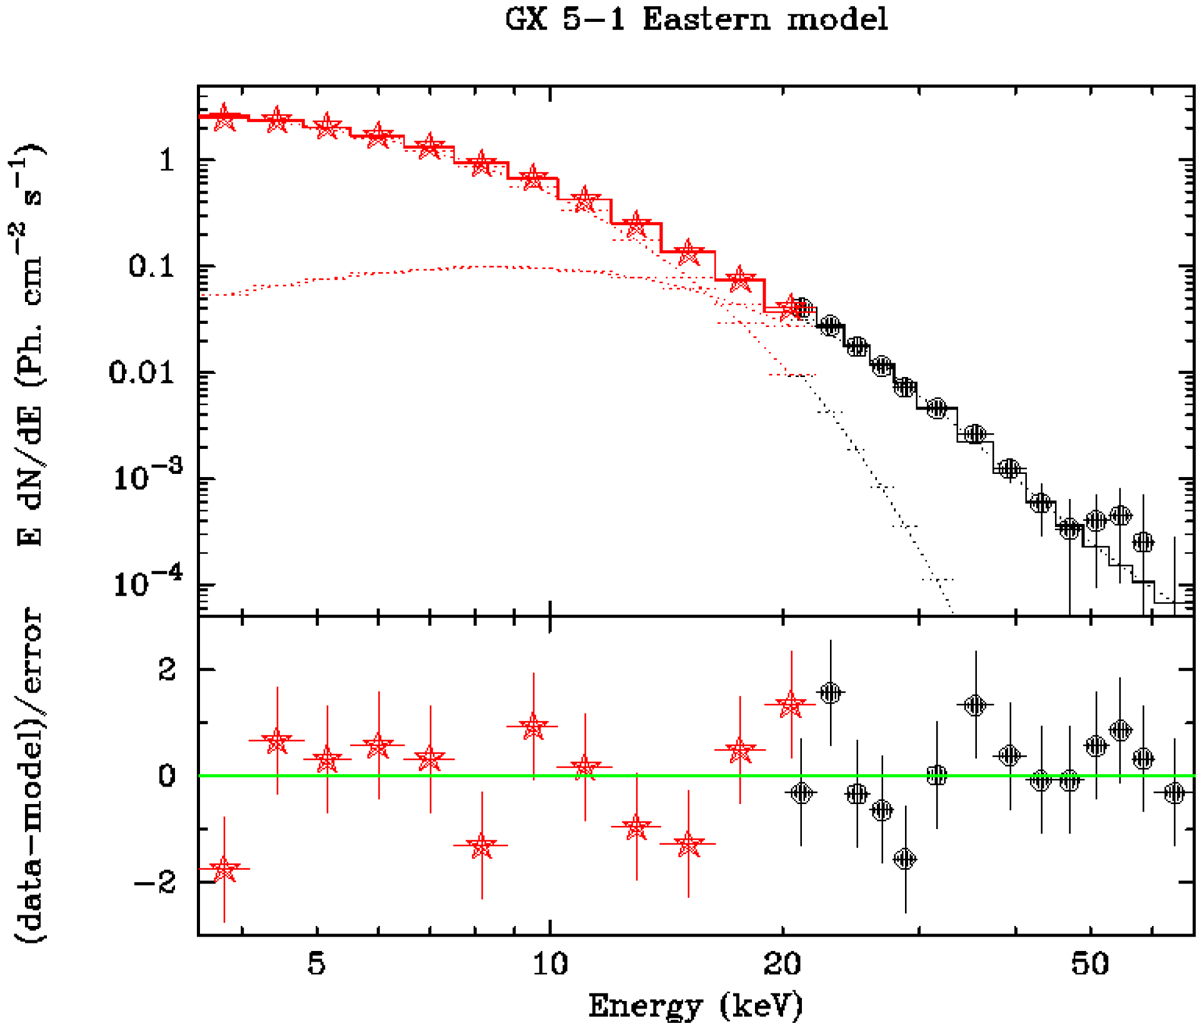
Time-averaged spectrum of GX 5–1 extracted from the same 44 science windows as in Paizis et al. (2005), collected in 2003 with a maximum pointing offset of 3° from the source. Red stars and black circles represent JEM-X2 and ISGRI data, respectively. The dotted lines represent the two components of the eastern model with best-fit parameters (Table 1).
Current usage metrics show cumulative count of Article Views (full-text article views including HTML views, PDF and ePub downloads, according to the available data) and Abstracts Views on Vision4Press platform.
Data correspond to usage on the plateform after 2015. The current usage metrics is available 48-96 hours after online publication and is updated daily on week days.
Initial download of the metrics may take a while.