Fig. B.1.
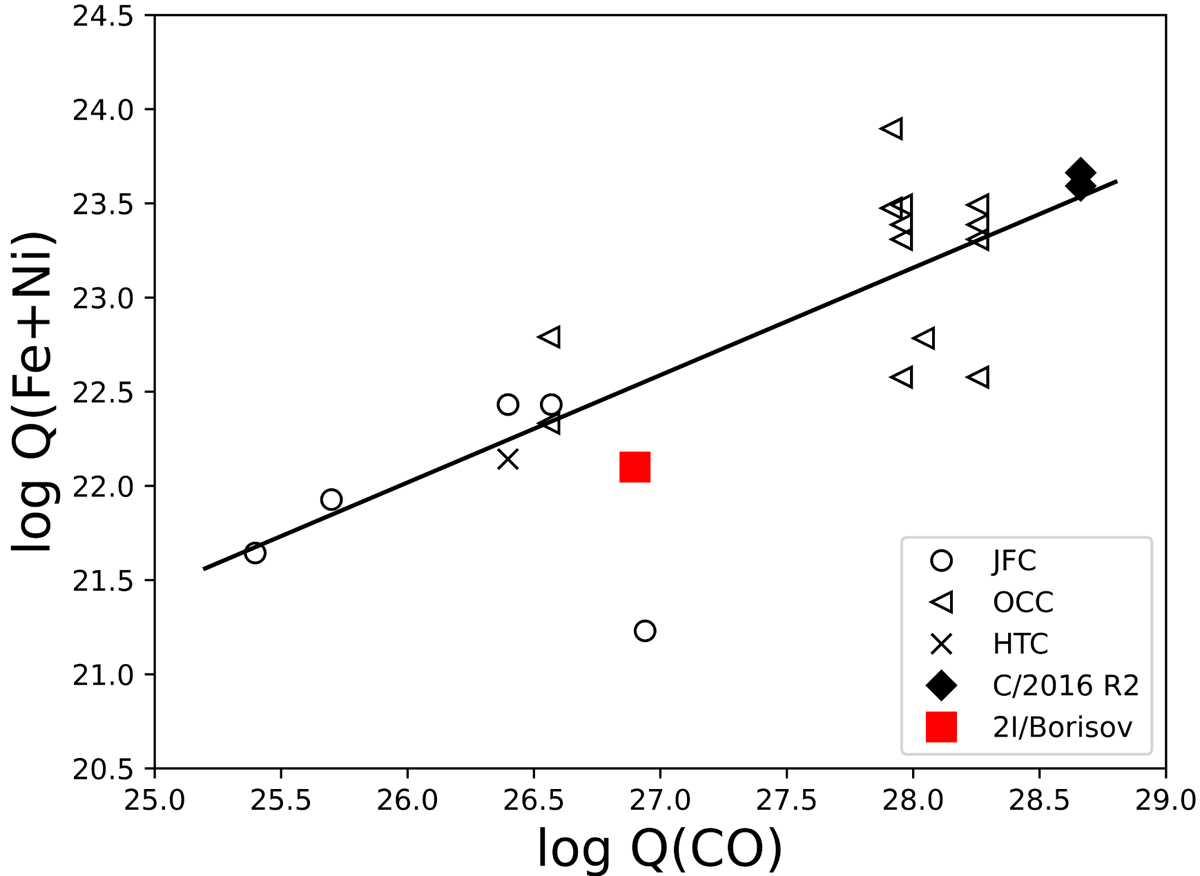
Sum of the production rates of FeI and NiI as a function of the CO production rate for 2I/Borisov, compared to the values measured by Manfroid et al. (2021) for a sample of Solar System comets (JFC, OCC, and HTC). The black line represents the best correlation for Solar System comets from Manfroid et al. (2021) (excluding C/2016 R2). The JFC located below the trend is 9P/Tempel 1.
Current usage metrics show cumulative count of Article Views (full-text article views including HTML views, PDF and ePub downloads, according to the available data) and Abstracts Views on Vision4Press platform.
Data correspond to usage on the plateform after 2015. The current usage metrics is available 48-96 hours after online publication and is updated daily on week days.
Initial download of the metrics may take a while.