Fig. C.2.
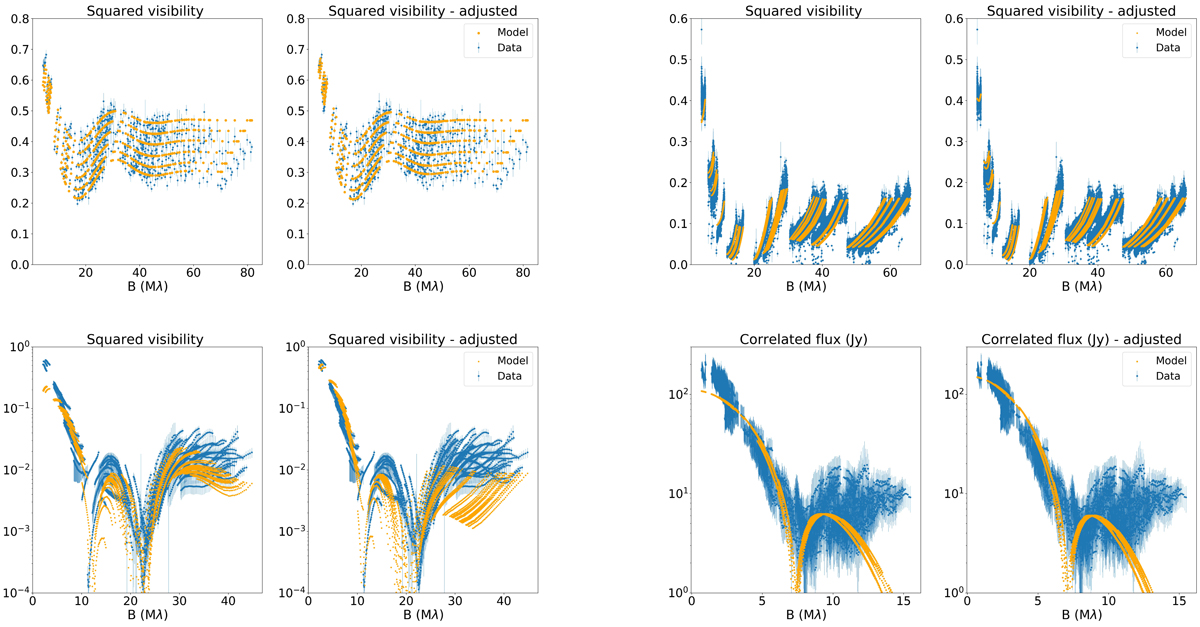
Illustration of the effect of increasing the weight of the shortest baselines in order to fit those baselines. Top left: H-band. Top right: K-band. Bottom left: L-band. Bottom right: N-band. Left panels: fit of the Gaussian ring model while leaving the data as they are. Right panels: fit when the weight of the shortest piece of baseline data is increased. Only the effect on the Gaussian ring model is shown. For H (B < 8 Mλ), K (B < 5.5 Mλ), and L (B < 3.5 Mλ), the effect of increasing the weight of the shortest baselines is the same for both the Gaussian ring model and the flat disc model, while the shortest baselines were fitted in the flat disc model without a modification on the weights of the shortest baselines (B < 2.5 Mλ) for the N-band. By increasing the weight on the shortest baselines for L, the shape of the longer baselines was shifted such that overall lower visibilities are predicted. This latter effect does not arise when fitting with the flat disc model.
Current usage metrics show cumulative count of Article Views (full-text article views including HTML views, PDF and ePub downloads, according to the available data) and Abstracts Views on Vision4Press platform.
Data correspond to usage on the plateform after 2015. The current usage metrics is available 48-96 hours after online publication and is updated daily on week days.
Initial download of the metrics may take a while.